
Photo by Gwenn Klabbers on Unsplash
This post is following of above post.
This time, let's see which country has the most increased doctors' consultation from 2007 to 2012.

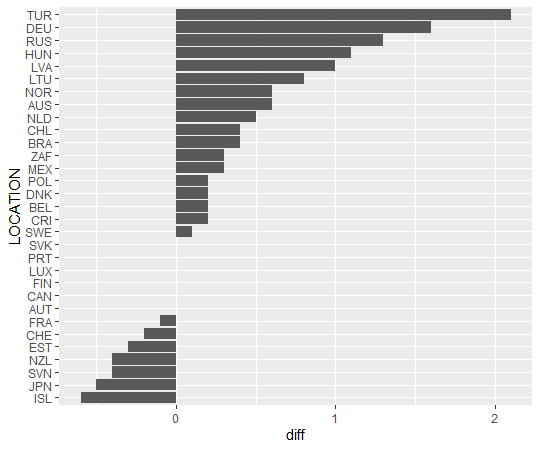
We see TUR(Turkey) is the most incleasing country by net change.
Then, how about percent change?
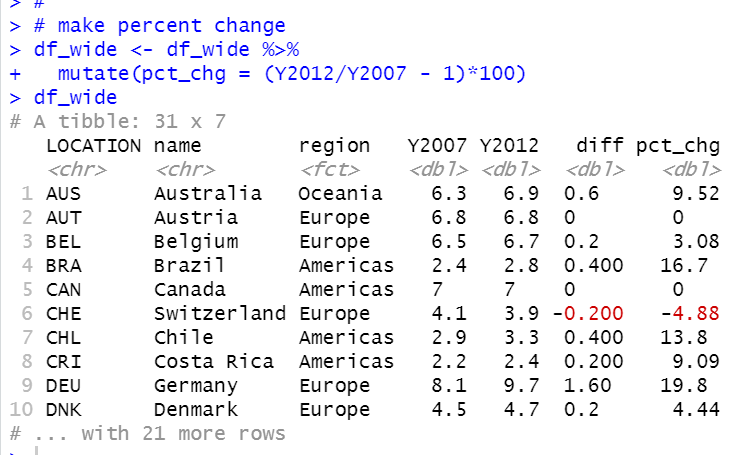
First, I make pct_chg.


For percent change, TUR(Turkey) is the top country too.
I suppose pct_chg is correlated to Y2007 value, the larger Y2007, the smaller pct_chg.
Let's check it with cor.test() function.

correlation is -0.1558882, it is nagative. So Y2007 and pct_chg has negative correlation relationship, but p-value is 0.4024 and 96% confidence interval is -0.48 to 0.21. So, this negative correlation is not statistically significant.
Let's make a scatter plot for Y2007 and pct_chg.


I don't see linear relationship between Y2007 and pct_chg.
That's it . Thank you!
Next post is ...
To read the 1st post,