
Photo by DAVID TANG on Unsplash
This post is following of above post.
In this blog, I will do regression anaysis using lm() function in R.
Let's go ahead.

summary() function displays result.
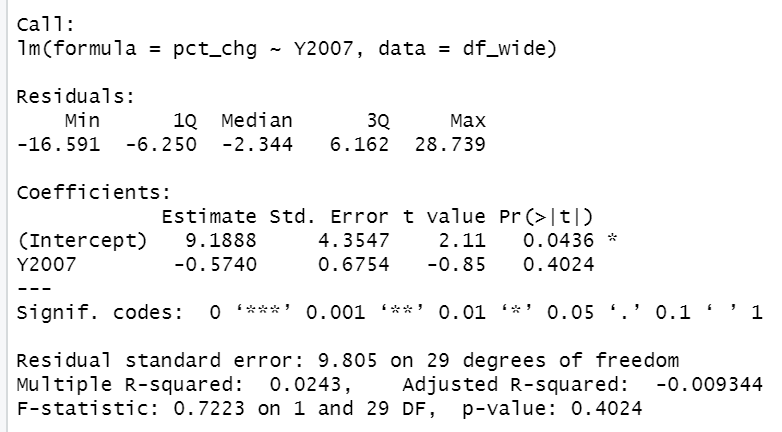
p-value is 0.4024, it is greater than 0.05, so this model is not valid model.
Let's add 'region' to explanatory variable.
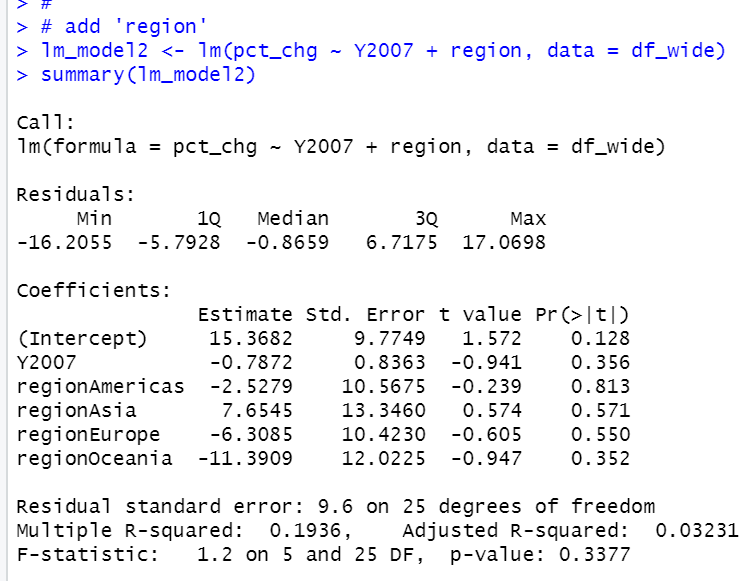
p-value is 0.3377.
Let's add quadratic of pct_chg
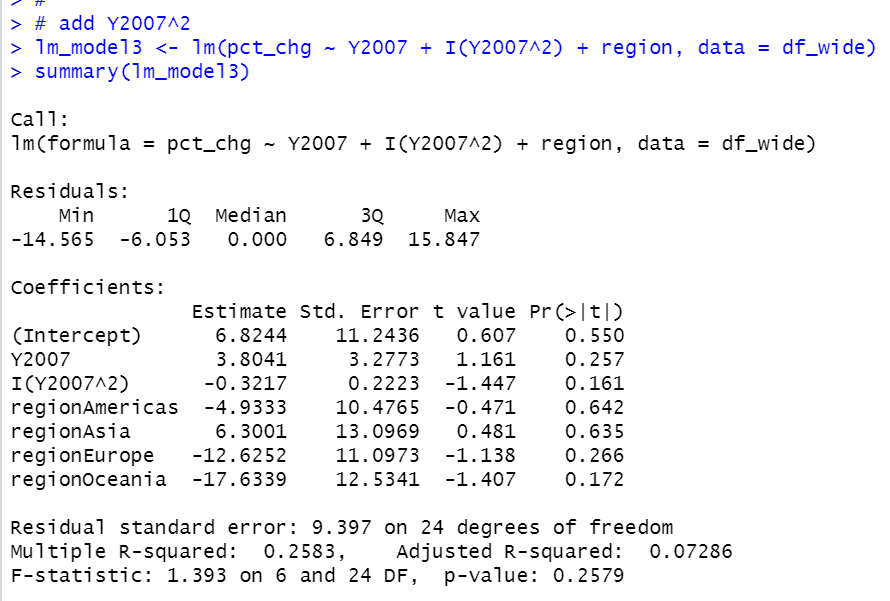
p-value is 0.2579, it is not valid.
Uhmm.... let's add Y2007^3 , Y2007^4 and Y2007^5.
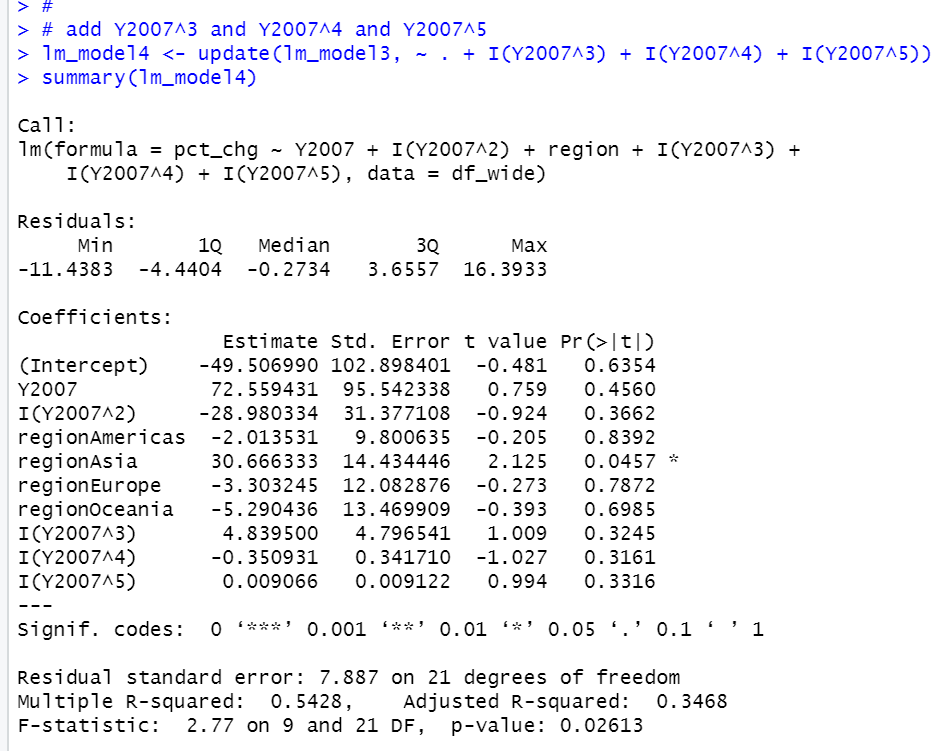
p-value is o.02613, it is smaller than 0.05.
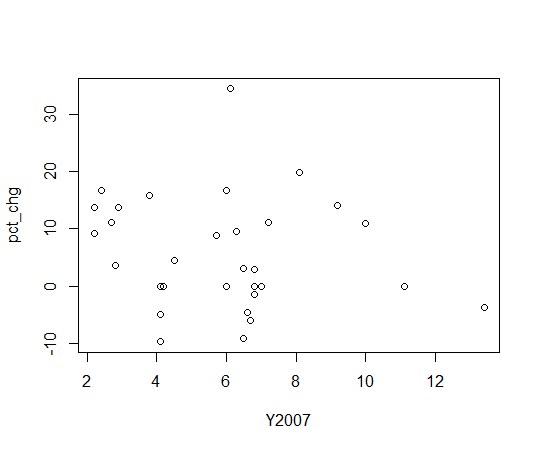
Let's plot scatther plot of Y2007 and pct_chg and add predicted values.
First, makeing plot

next, adding predicted values.

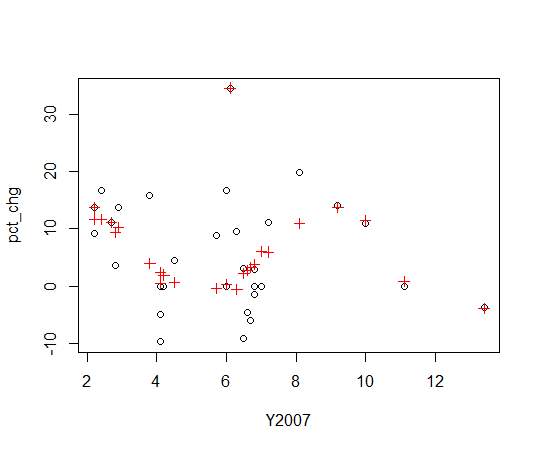
red + is predicted value by lm_model4.
That's it. Thank you!
To read the 1st post...