
Photo by Tegar Surya on Unsplash
This post is following of above post.
In this post, let's do t-test with t.test() function using R.
In the previous post we see International Mobility is gradually increasing.
Let's confirm it if it is statistically sognificant or not.
Firstly, let's make data frame that contains countries which have 10 observations.


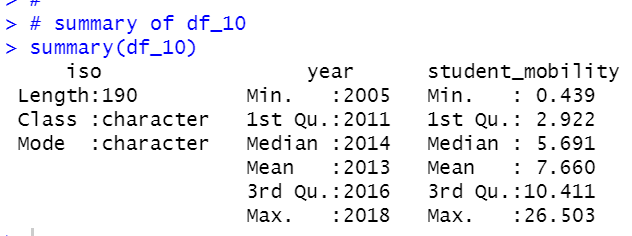
We see the oldest year is 2005 and the newest year is 2018.
Let's compare 2005 student_mobility and 2018 student_mobility.
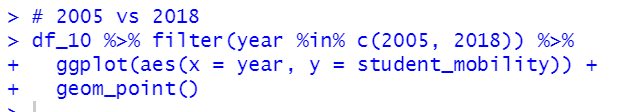
We see 2018 value is higher than 2005 value in general.
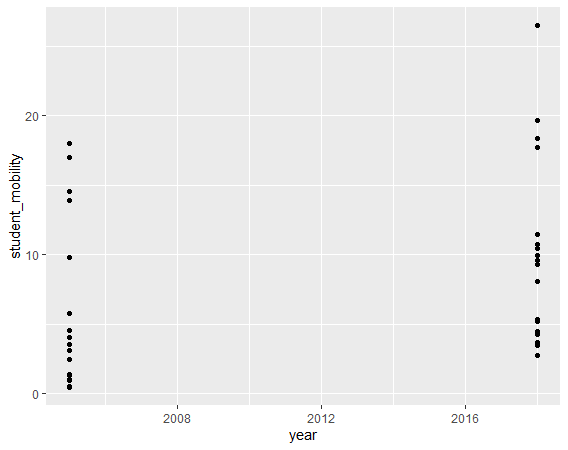
Let's compare summary statistics.
In 2005, student_movility average is 5.448 while it is 9.936 in 2018.
Let's do t-test with t.test()
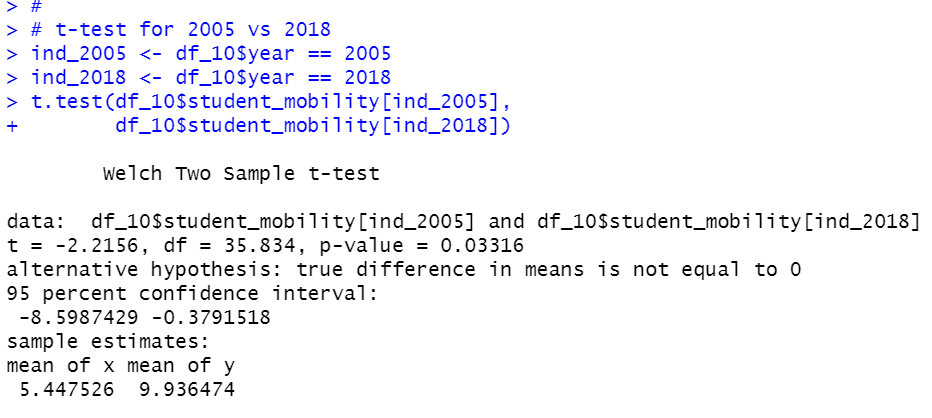
We see p-value is 0.03316.
So, 2005's student mobility and 2018's student mobility are statistically different in 5% significant level.
That's it. Thank you!
Next post is.
To read the 1st post,