
Photo by BP Miller on Unsplash
This post is following of the above psot.
In this post, let's test if there is serial correlation.
Firdt of all, load lmtest package.

All right, let's start with model1.
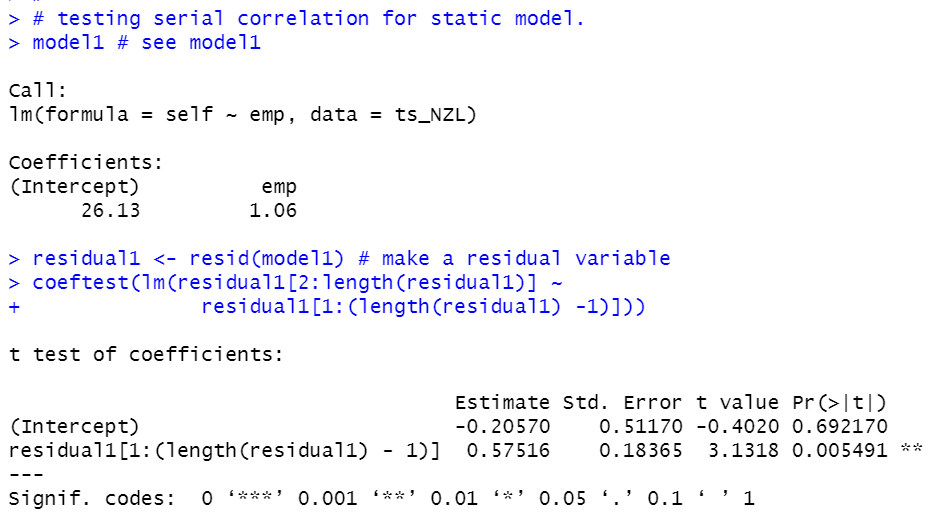
p-value of lag residual is 0.005491. So, model1 has serial correlation.
Let's check model2.
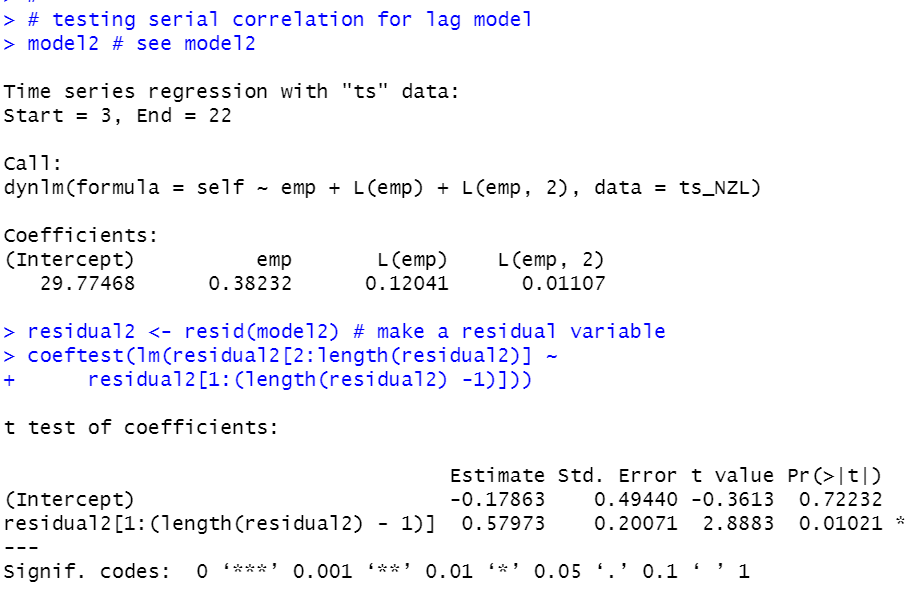
p-value is 0.01021. So, model2 also has serial correlation.
How about model3?
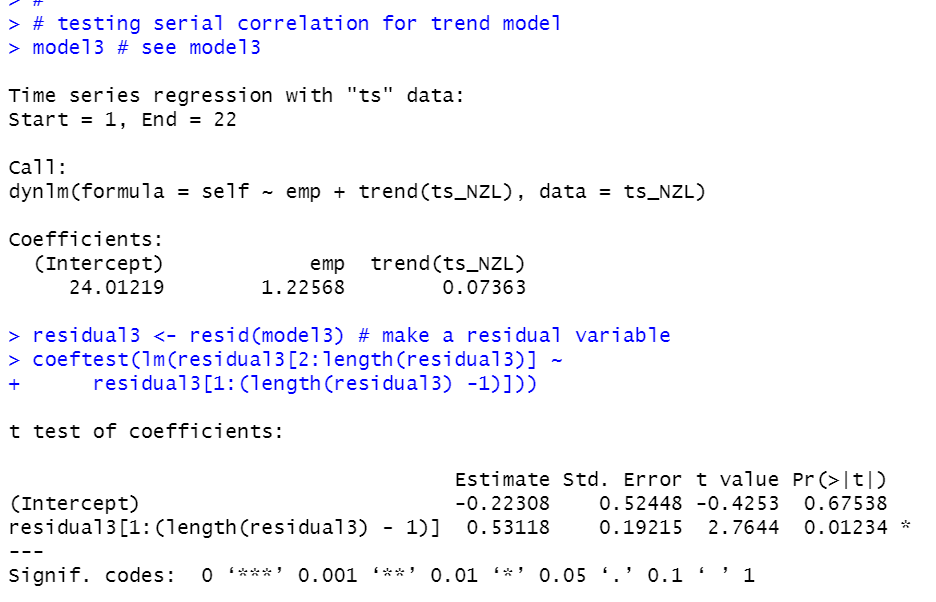
p-value is 0.01234, so model3 also has serial correlation.
We see model1, model2 and model3, all models have serial correlation.
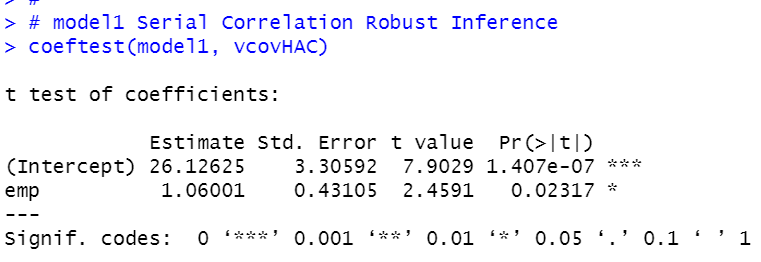
So, let's do serial correlation robust inference.
First, load sandwich package.

model1 serial correlation robust inference.
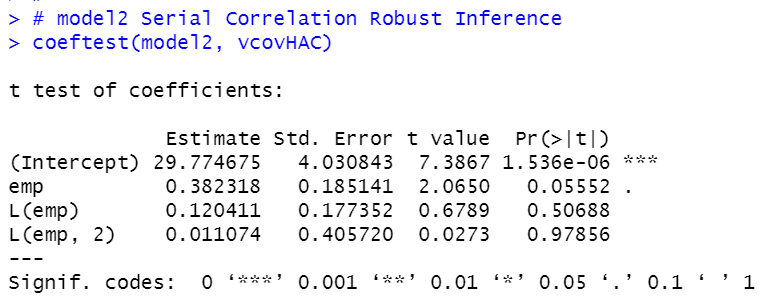
model2 serial correlation robust inference.
model3 serial correlation robust inference
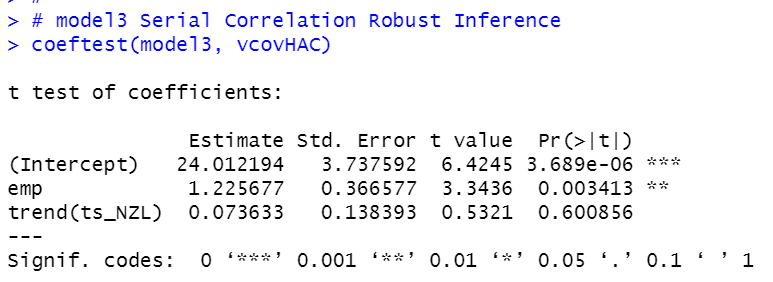
model3's emp p-value is 0.003413, it is the smallest among model1, model2 and model3.
So, model3 seems the best model
Lastly, let's compare r-squared.
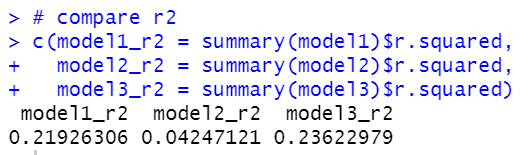
We see model3 has the largest r-squared, 0.236.
That's it. Thank you!
To see the 1st post,