
Photo by Nathan Anderson on Unsplash
This post is following of above post.
Let's see coun: country.
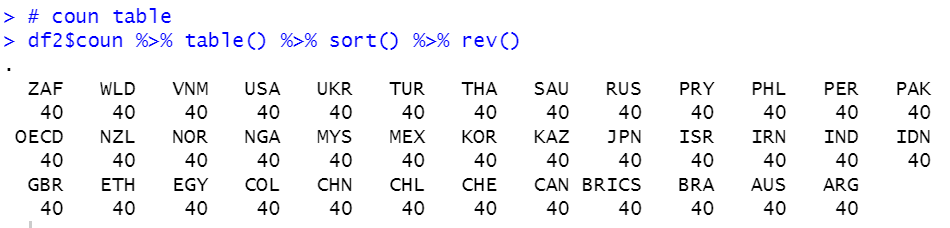
We see all country have 40 observations.
Let's see year
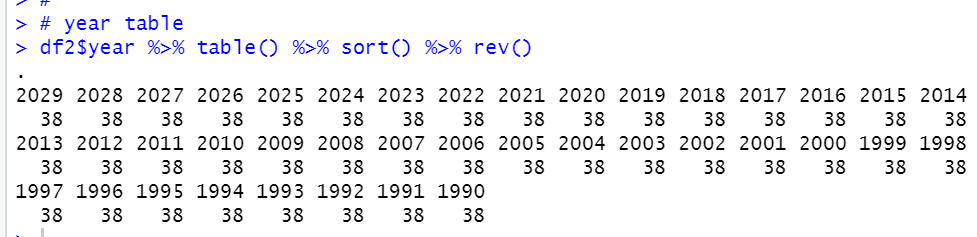
We see all year have 38 observations.
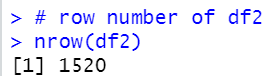
So, df2 data frame is 40 coun * 38 year = 1520 observations.
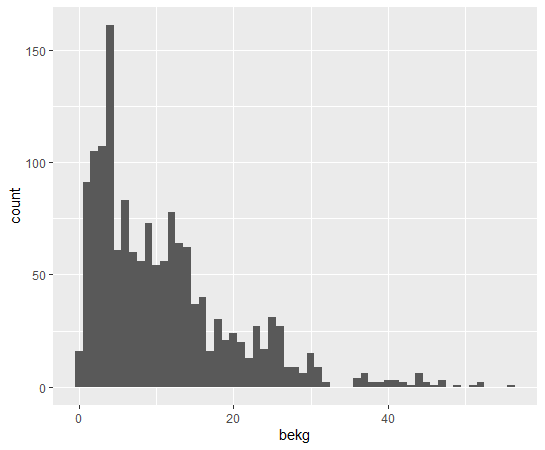
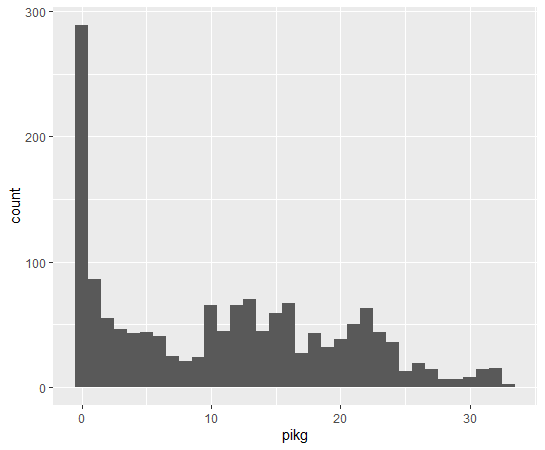
Let's see histograms for KG_CAP data.
First, bekg: BEEF KG_CAP

pikg: PIG KG_CAP

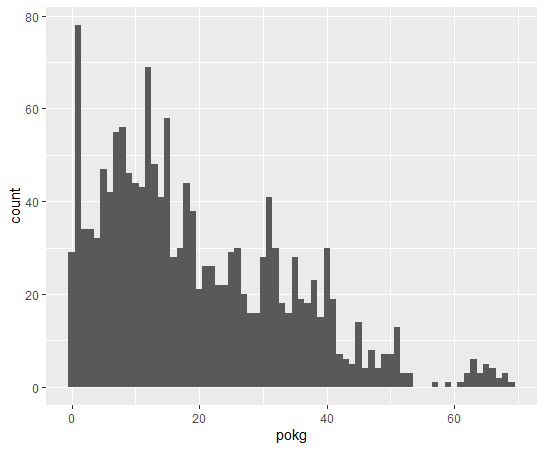
pokg: POULTRY KG_CAP

shkg: SHEEP KG_CAP

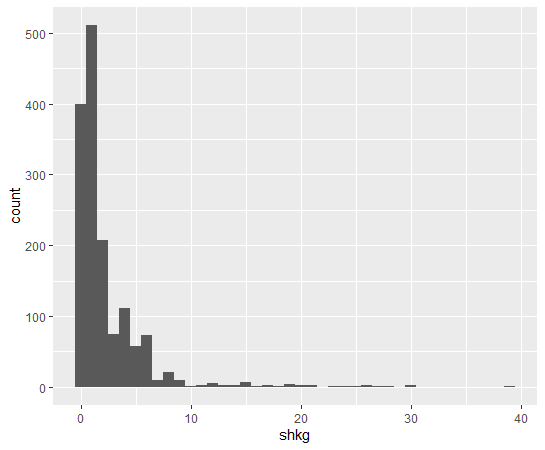
We see POULTRY is most normaly spread.
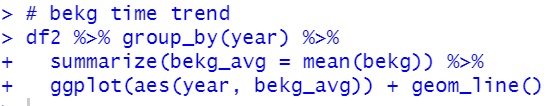
Next, let's see time trend.
We will see average KG_CAP by year.
First, bekg: BEEF KG_CAP
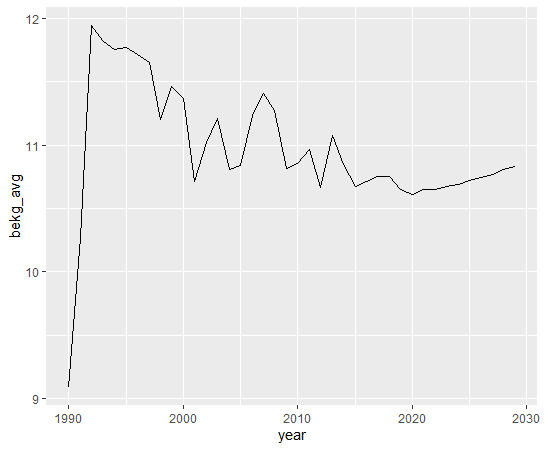
pikg: PIG KG_CAP time trend
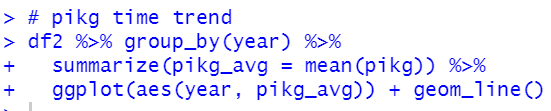
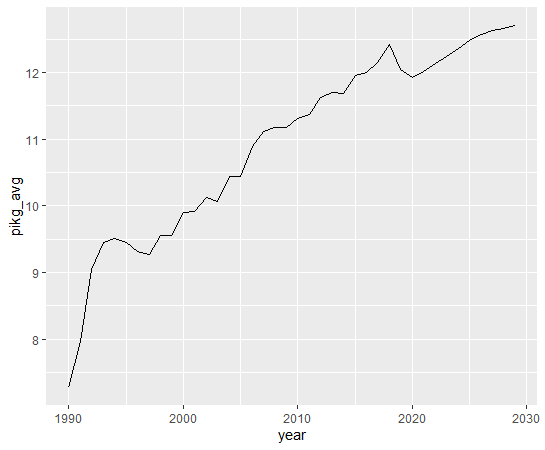
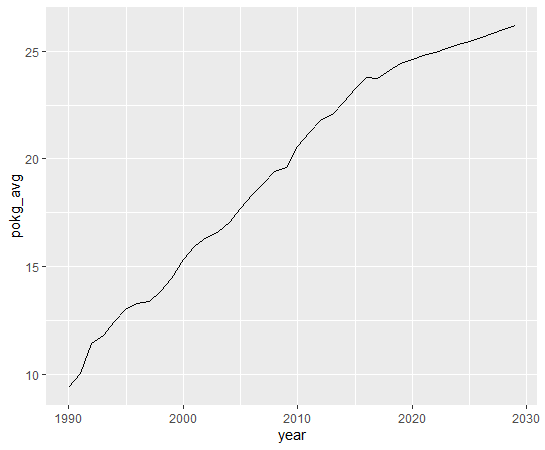
pokg: POULTRY KG_CAP time trend
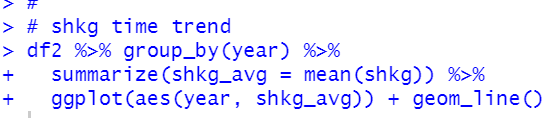
shkg: SHHEP KG_CAP time trend
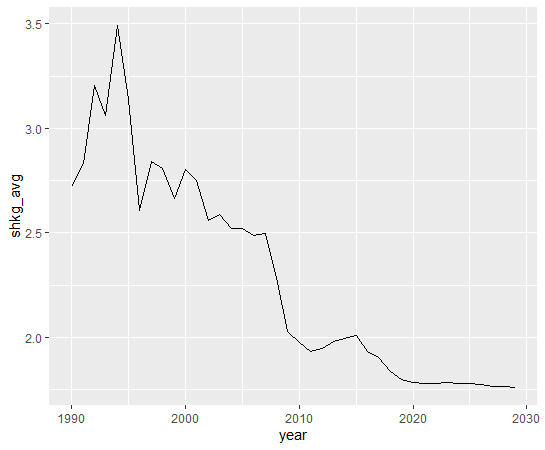
We see BEEF and SHEEP are on down trend and PIG and POULTRY are on up trend.
That's it. Thank you!
Next post is
To read the 1st post,