www.crosshyou.info

政府統計の総合窓口のデータや、OECDやUCIやのデータを使って、Rの練習をしています。ときどき、読書記録も載せています。

OECD NEET Data Analysis 3 - correlation between MEN_15_29 and WOMEN_15_29. It is positive correlation.

f:id:cross_hyou:20210929171219j:plain

Photo by Michael D Beckwith on Unsplash 

www.crosshyou.info

This post is following of above post.

Let's see time-series distribution for 15_29_MEN and 15_29_WOMEN

f:id:cross_hyou:20210929171639p:plain

f:id:cross_hyou:20210929171650p:plain

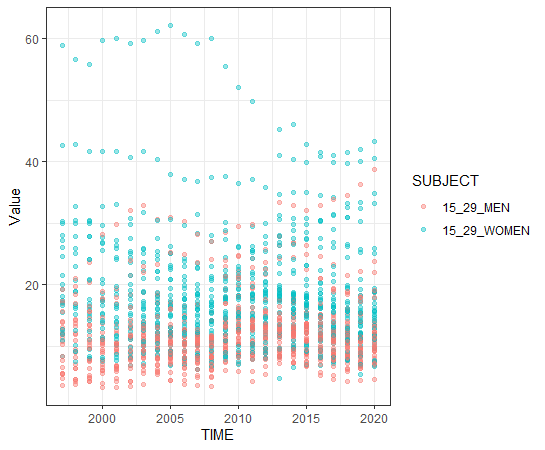
It is a bit difficult to see trends.
So, I divided before 2010 and after 2011 and use density chart.

f:id:cross_hyou:20210929171823p:plain

f:id:cross_hyou:20210929171836p:plain

For distribution, there is not clear difference between before 2010 and after 2011.

Next, let's examone correlation between 15_19_MEN and 15_29_WOMEN.

f:id:cross_hyou:20210929172031p:plain

correlation is 0.597. So there is positive correkation.
Let's make a scatter plot.

f:id:cross_hyou:20210929173030p:plain

f:id:cross_hyou:20210929173040p:plain

Maybe, it is better to filter years.

f:id:cross_hyou:20210929173629p:plain

f:id:cross_hyou:20210929173640p:plain

That's it. Thank you!

Next post is


www.crosshyou.info


To see the 1st post,


www.crosshyou.info