Photo by William Olivieri on Unsplash

In this post, I will analyze OECD Business confidence index(BCI) using R.
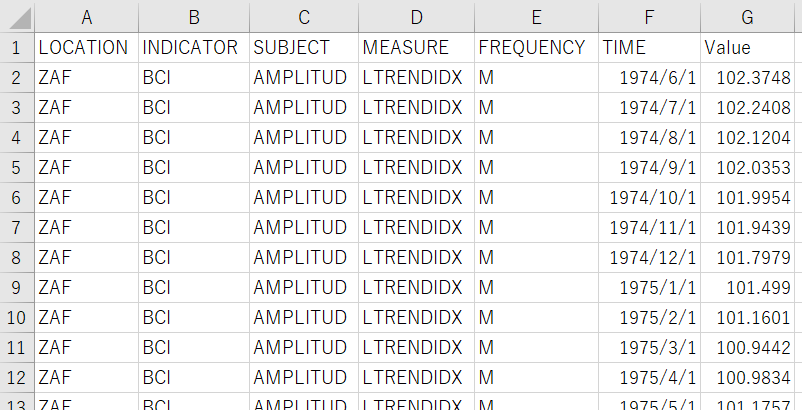
From the OECD web site, I download below CSV file.

Firstly, I load tidyverse package.

Then, I use read_csv() finction to read the CSV file data into R.

Okay, It seems I successfully loaded the data.
Let's check each variables one by one.
LOCATION

LOCATION is ISO country code. USA has the most observations.
INDICATOR

INDICATOR has only one value, BCI, so I will delete it later.
SUBJECT

SUBJECT has only one value, AMPLITUD. I will delete SUBJECT too.
MEASURE

MEASURE has only one value, LTRNDIDX. I will delete it too later.
FREQUENCY

FREQUENCY has only one vatiable, M, it means Monthly. I will delete it too.
TIME

TIME is observation year and month. But it is recognized as character string.
So, I have to convert it to date time class.
Value

Value is BCI(Business Confidence Index). Greater than 100 means increased confidence in near future. Mean is 100.
All right, I will delete INDICATOR, SUBJECT, MEASURE and FREQUENCY

I will change TIME from character strings to data time class.

And, I will change variable names to some easy characters.

All right. let's see summary of df.

I see df has 21017 observations from iso's Length.
The oldest time si 1950-01-01 and the newest time is 2021-11-01, it is a bit strange because it is 2021-10-17 today.
bci has average 100 and minimum is 83.23 and maximum is 109.51.
That's it. Thank you!
Next post is