
This post is following of the above post.
In the previous post, I loaded OECD Trust in government data.
Let's see overall histogram of the data. I use hist() function.
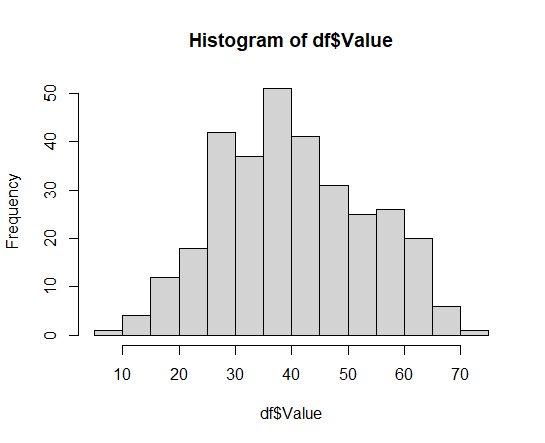
It looks like normal distribution.
Next, let's see distribution by TIME. I use boxplot() function.
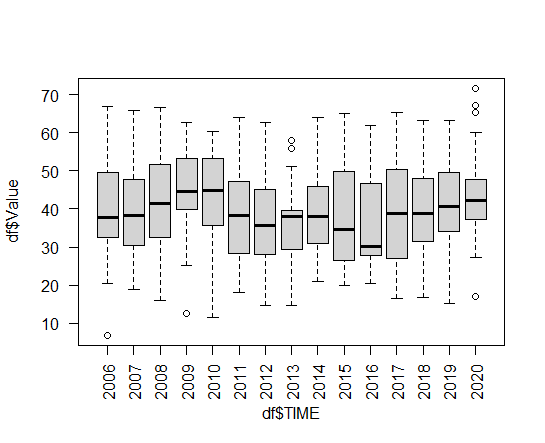
It seems there is not significant different by year.
Let's check it with aov() function.
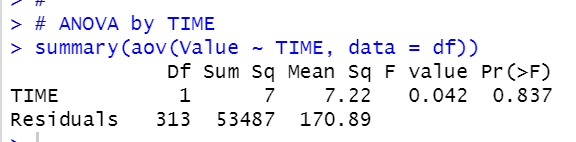
p-value is 0.837, so I cannot reject H0: Value is the same for each TIME.
Next, let's see Value by LOCATION.
First, I sorted LOCATION by median value.
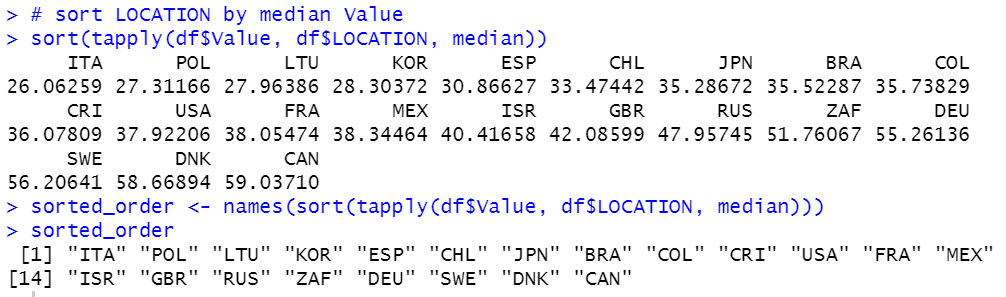
ITA has the lowest median value and CAN has the highest.
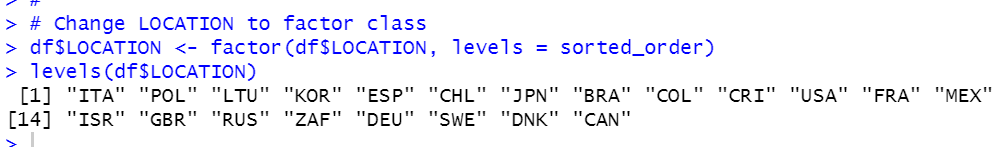
Then, I change LOCATION to factor class, level order is sorted_order.
Then, I use boxplot().
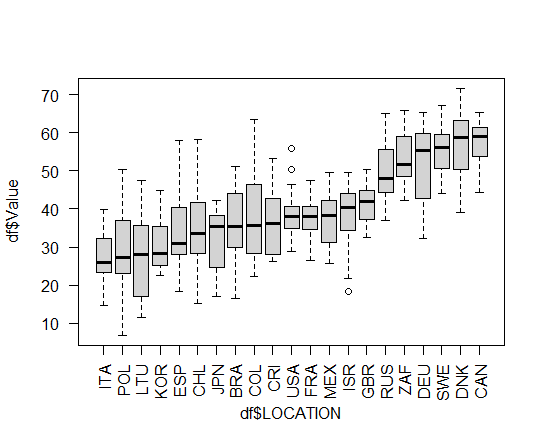
It seems there is significanr difference value by LOCATION.
Let's confirm it.
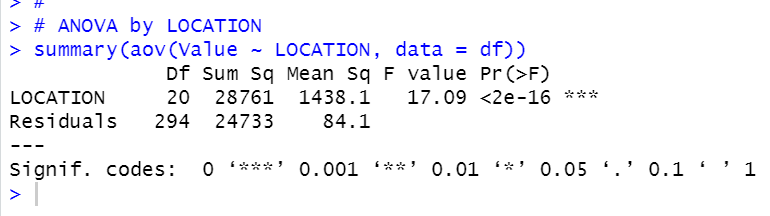
p-value is less than 2e-16. So, I reject H0: Value is the same by LOCATION.
That's it. Thank you!
Next post is
To read from the 1st post,