
Photo by Dulana Kodithuwakku on Unsplash
This post is following of the above post.
Let's make log(capi) as l_capi.

Let's make a scatter plot for trust and l_capi.

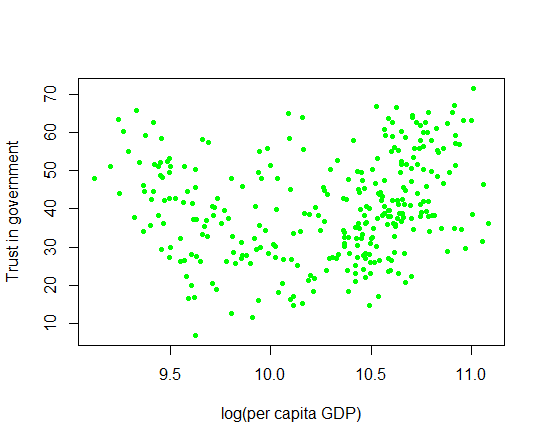
It seems there is not clear relationship.
Then, I load broom package because I would like to use tidy() function with lm object.

All right, I will make some linear regression analysis, dependent variable is trust and independent variable is gdp, l_gdp, capi and l_capi. I will do it by year and by iso.
So, I will make 4 * 2 = 8 set of linear regression anaysis.
1. Independent variable = gdp by year.
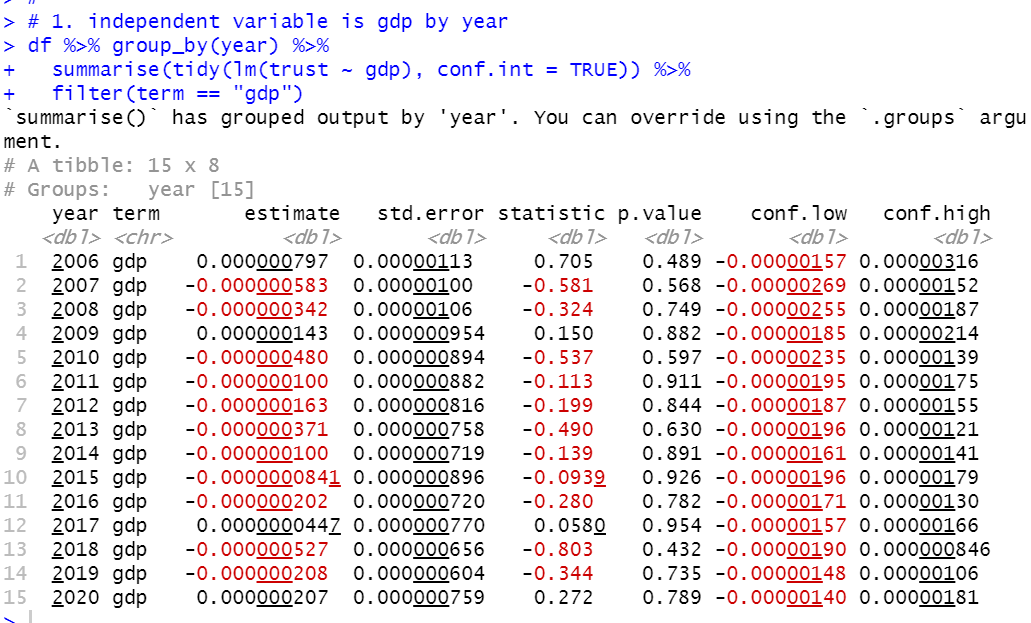
For all year, from 2006 to 2020, p.value is greater than 0.05. So, by year regression, gpd is not significant variable fot trust.
2. Independent variable = gdp by iso
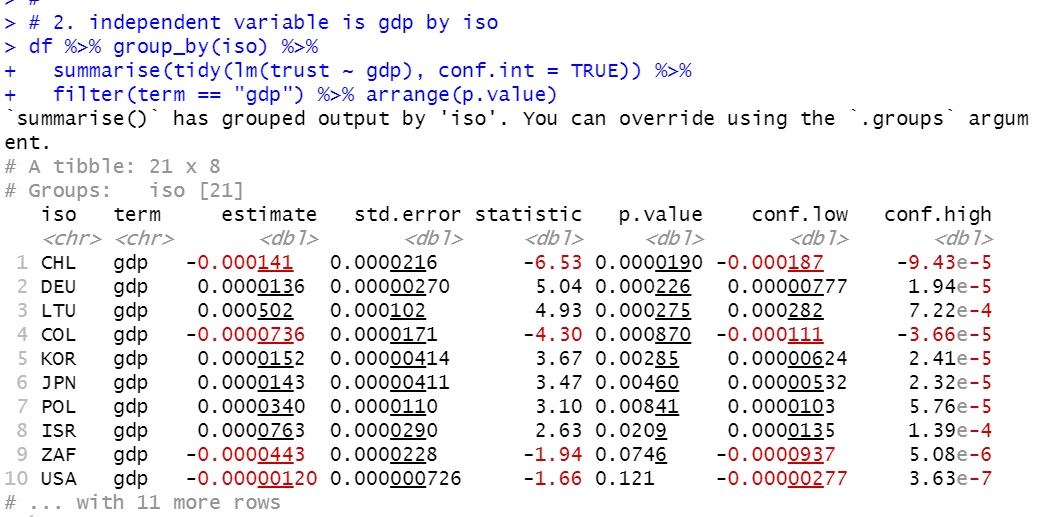
Since there are 21 iso-s, I display the result p.value ascending order. CHL and COL hasve negative coefficient and others have positive coefficient. There are only 8 iso-s which have less than 0.05 p.value.
3. independent variable = l_gdp by year.
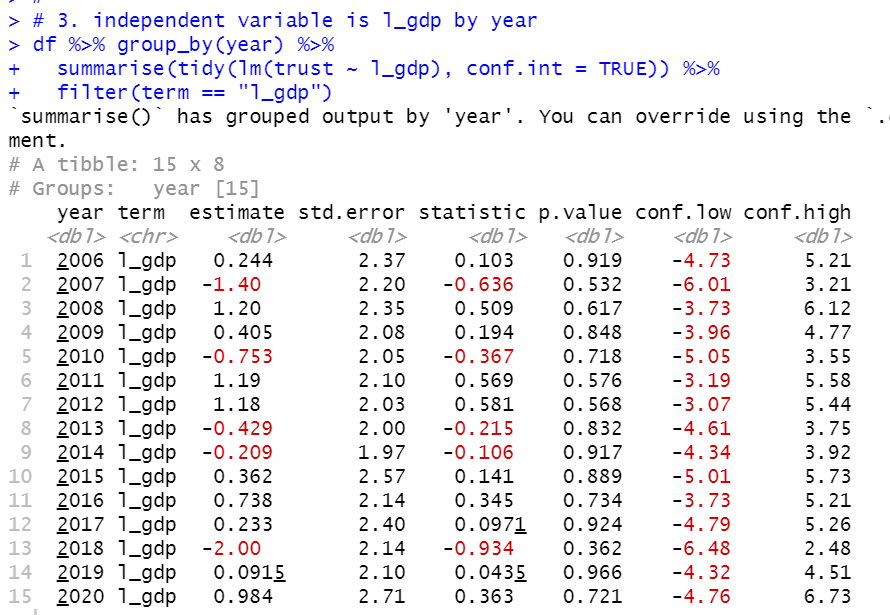
We also see there is no year which have less than 0.05 p.value.
4. independent variable = l_gdp by iso.
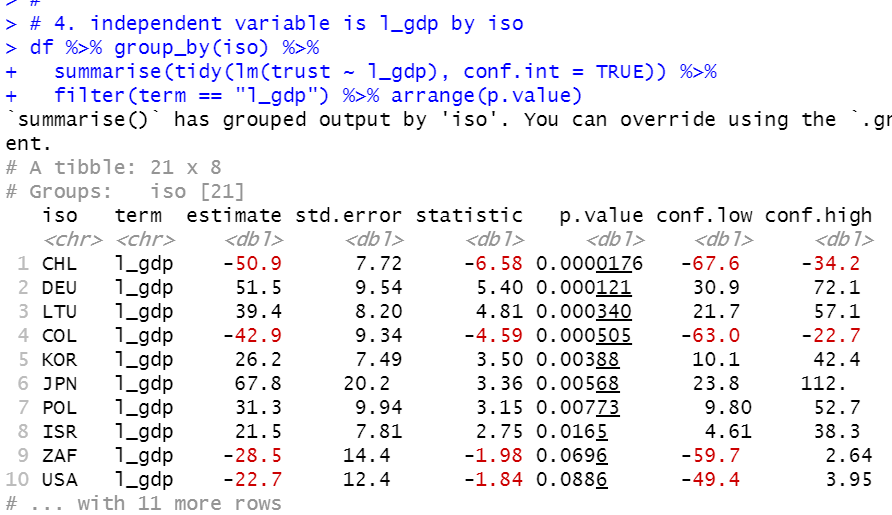
Again, CHL and COL have negative coefficient with less than 0.05 p.value.
There are 8 iso-s which have less than 0.05 p.value.
I assume it is possible for GDP to affect Trust in government, but there must be other factors to affect it.
That's it in this post, next post I will see capi and l_capi.
Next post is
To see the 1st post