Photo by Ivana Cajina on Unsplash
In this blog, I will analyze OECD Material productivity data.

First, I downloaded data from the OECD webiste: Materials - Material productivity - OECD Data
OECD (2022), Material productivity (indicator). doi: 10.1787/dae52b45-en (Accessed on 12 February 2022)
The downloaded CSV file looks like below.

I use R to analyze the data, so I firstly load tidyverse package and use read_csv() function to load the CSV file.


Let's check each variables. For character variables, how many vales are there, for numeric variables, summary statistics.
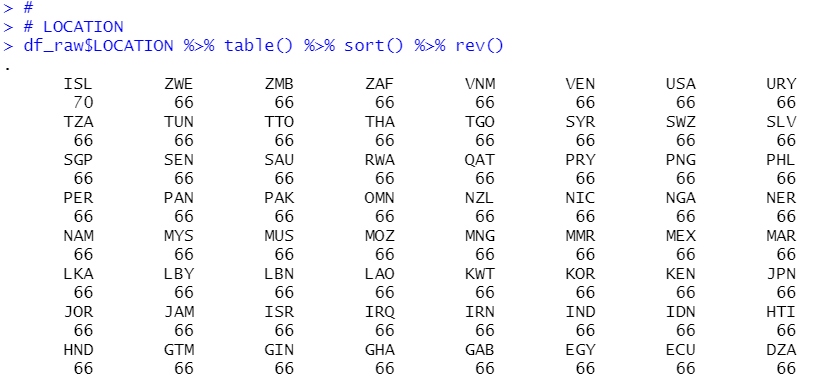
LOCATION

There are many locations.
INDICATOR

For INDICATOR, there is only one value, MATPROD, so we can delete INDICATOR.

SUBJECT

There are two kinds of vakue, TOTMAT and NONNRGMAT. So I keep SUBJECT.
MEASURE

There is only one value in MEASURE, it is USD_KG. I will remove MEASURE.

FREQUENCY

There is only one value in FRQUENCY, it is A. I will remove FREQUENCY.

TIME

For TIME, it starts in 1980 and ends in 2019. There is not NA value.
Value

There is not NA value in Value.
Now, my new dataframe, df has LOCATION, SUBJECT, TIME and Value.

I know SUBJECT has two kinds of value, one is TOTMAT and the oter is NONNRGMAT.
So, I want to reshape my dataframe df like below
LOCATION TIME TOTMAT NONNRGMAT
AUS 1990 XXX XXX
AUS 1991 XXX XXX
AUS 1992 XXX XXX
So, I will use pivot_wider() function.

All right.
Let's check summary statistics.

There are several NA's in NONNRGMAT and TOTMAT. So, I will delete NA rows

By the way, I have GDP and per capita GDP data file like below.

So, I will conbine this GDP data and Material productibity data.

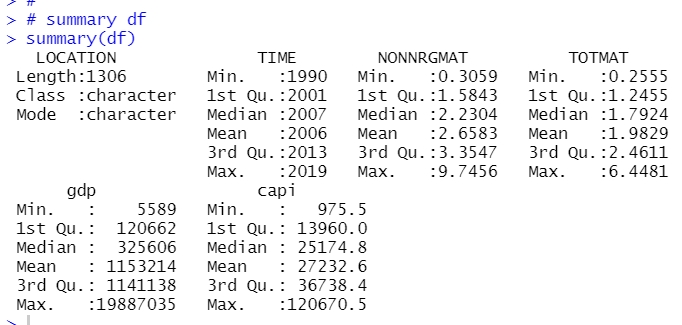
let's see summary stats.

That's it.
I will investigater further in next post.
Thank you!
The next post is