
Photo by Mateusz Klein on Unsplash
This post is following of the above post.
Let's make some graphs to get big picuture of the data.
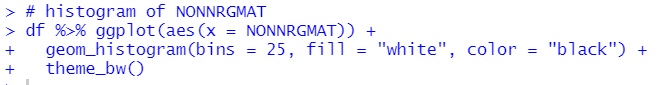
Fisrstly, I make histograms for each variables.
Let's start with NONNRGMAT
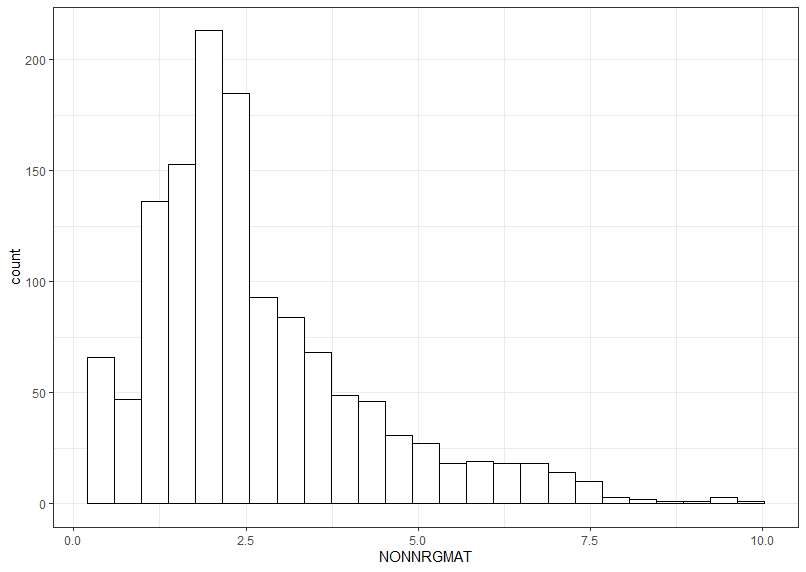
TOTMAT
before making gdp histogram, I load gridExtra package to arrange two histogram.
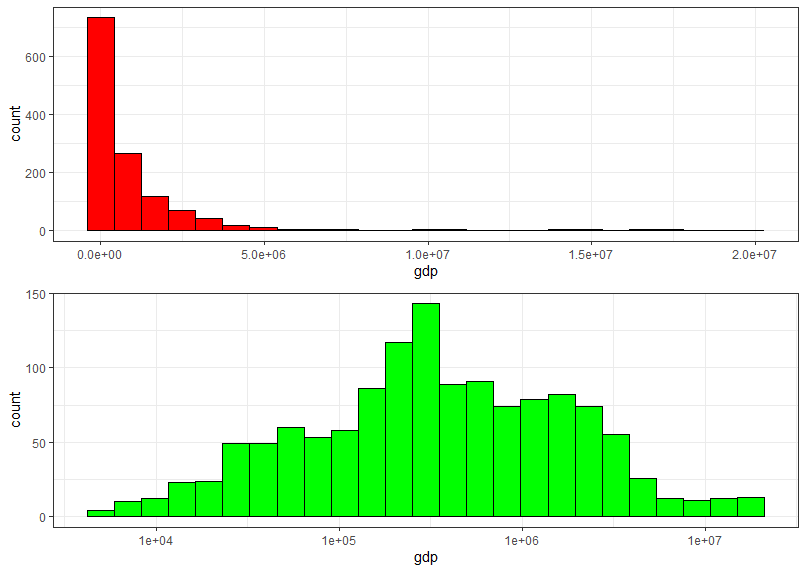
The lower histogram is log-scaled histogram. So, it is betther to use log(gdp) for analysis later.
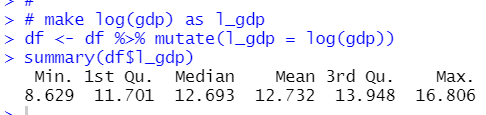
So, I make log(gdp) as l_gdp.
capi histogram
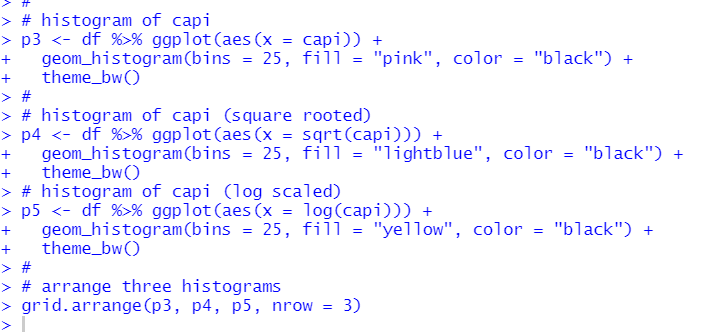
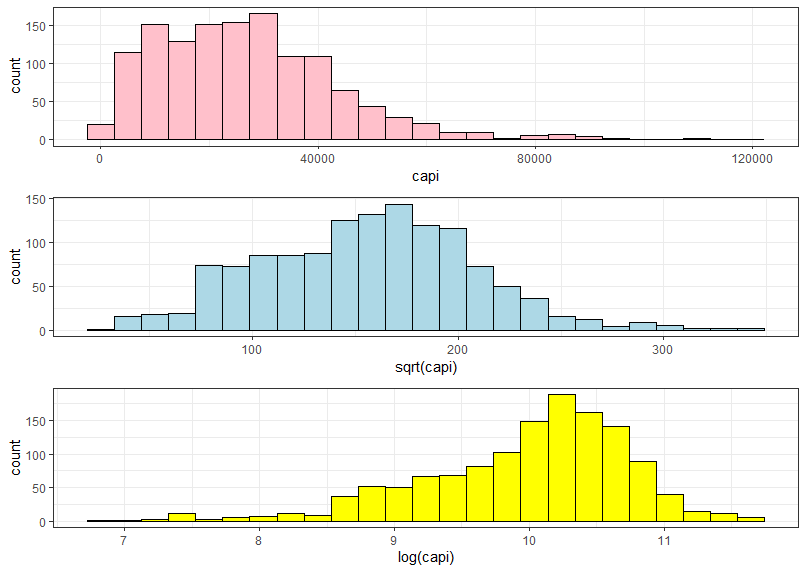
I see square rooted capi is the most synmetric distribution. So I make sqare rooted capi as r_capi.
Then, Let's see ranking by LOCATION for each variables.
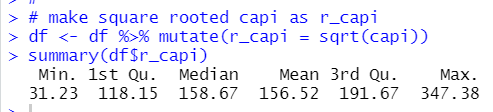
Firstly, I check which TIME has the most observations.
2010, 2011, 2012, 2013 and 2014 has 57 observations.
So, I use 2010 ~ 2014 data only.
NONNRGMAT ranking by LOCATION.
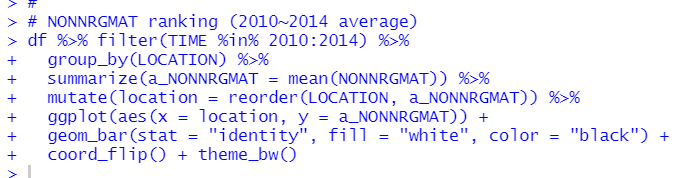
NLD is the 1st, GBR is the 2nd, LUX is the 3rd.
TOTMAT ranking by LOCATION
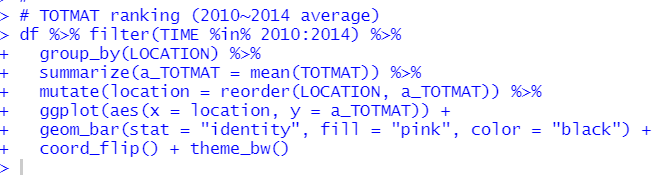
CHE is the 1st, LUX is the 2nd, NLD is the 3rd.
log(gdp) ranking
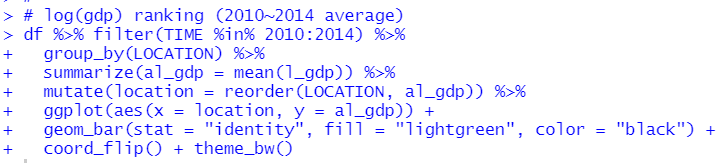
USA is the 1st, CHN is the 2nd, IND is the 3rd.
sqrt(capi) ranking
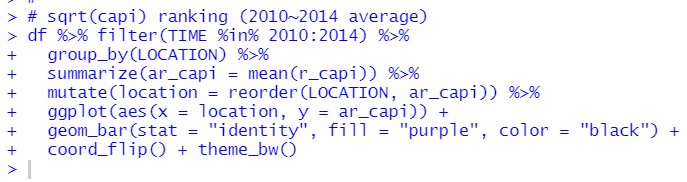
LUX is the 1st, SGP is the 2nd, NOR is the 3rd.
Lastly, let's make scatter plots.
I use PerformanceAnalytics::chart.Correlation() function
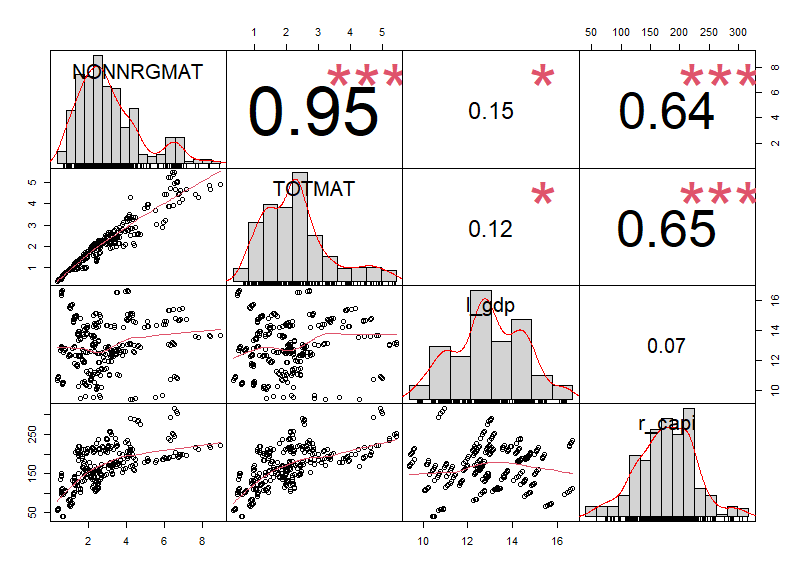
NONNRGMAT and TOTMAT has very high correlation.
r_capi and NONNRGMAT, TOTMAT has relatively high correlation.
l_gdp and NONNRGMAT, TOTMAT has weak correlation.
That's it.
Thank you!
The next post is
To see the 1st post,