

I will analyize ODEC Discriminatory family code.
Inequality - Discriminatory family code - OECD Data
I downloaded CSV file likde below from aboce web site.

Let's analyze with R.
Before load the CSV file, I load tidyverse package.

Then, I use read_csv() function to load the CSV file data into R.
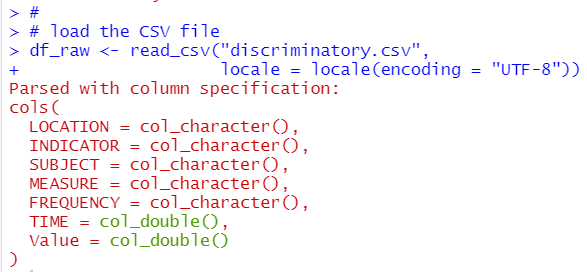
There are 7 variables. Let's check it one by one.
Let's begin with LOCATION. LOCATION is country code.
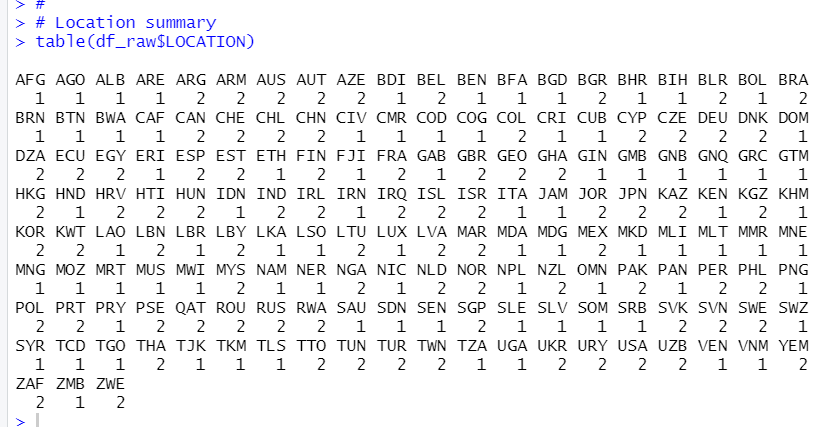
I see each location has 1 or 2 counts.
Next, INDICATOR

INDICATOR has only one value; DISCRIMFAMCODE, so we can remove this varibale from the data frame.

Next, SUBJECT

SUBJECT has two value, ATTWORKMUM and EARMARRIAGE.
SInce there are only 2 kinds of value, I change SUBJECT to factor type.

Next, MEASURE

MEASURE has only one value, PC. PC means percentage. I remove MEASURE.

Next, FREQUENCY

FREQUENCY has only one value, A. A means annual.
I remove FREQUENCY.

Next, TIME

TIME is year. I see min, max, median, max, and 1st quantile, 3rd quintile are all 2019.
I remove TIME.

Last variable is Value.

There is not NA in Value.
All right, let's use summary() function for the df.
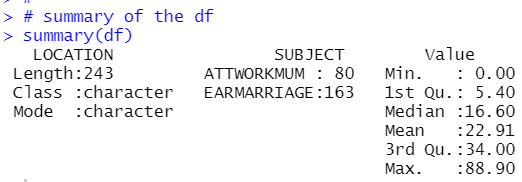
I see the df have 243 observations, two kinds of subject, one is ATTWORKMUM and the other is EARMARRIAGE, Value measn those SUBJECT's value.
That's it.
Thank you!
Next post is