
Photo by Jeremy Santana on Unsplash
This post is following of above post.
In the previous post, I get Confidence Interval using standard error.
In this post, I will get Confidence Interval using Bootstrap method.
Bootstrap method is to draw random samples many times and calclates sample averages and get quantile value.
Let's start with "atwm"; Attitudes Towards Working Mothers.
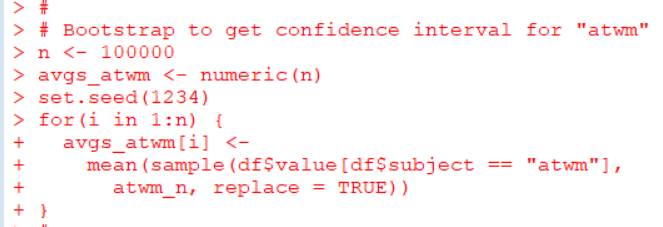
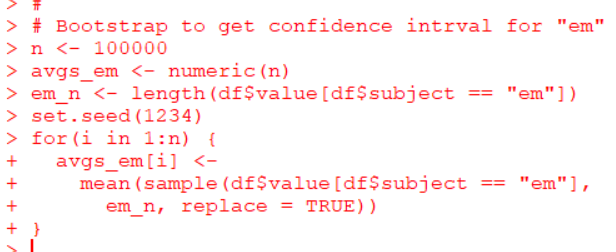
I draw 100,000 samples and calculate average 100,000 times. I use for() loop.
Those 100,000 averages are store in avgs_atwm object.
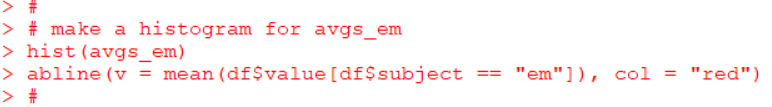
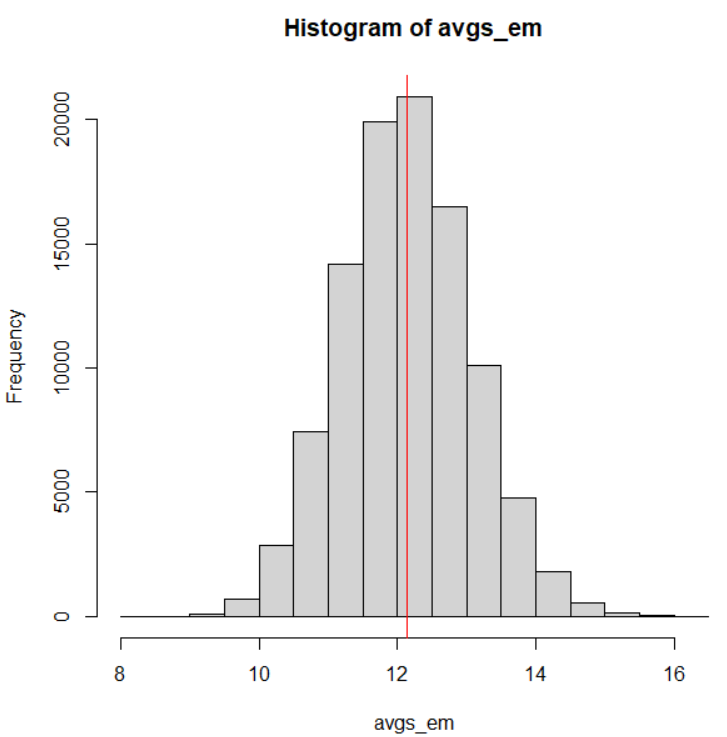
Let's see a histogram of avgs_atwm.
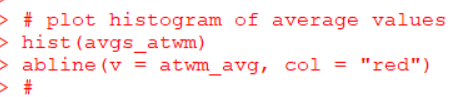
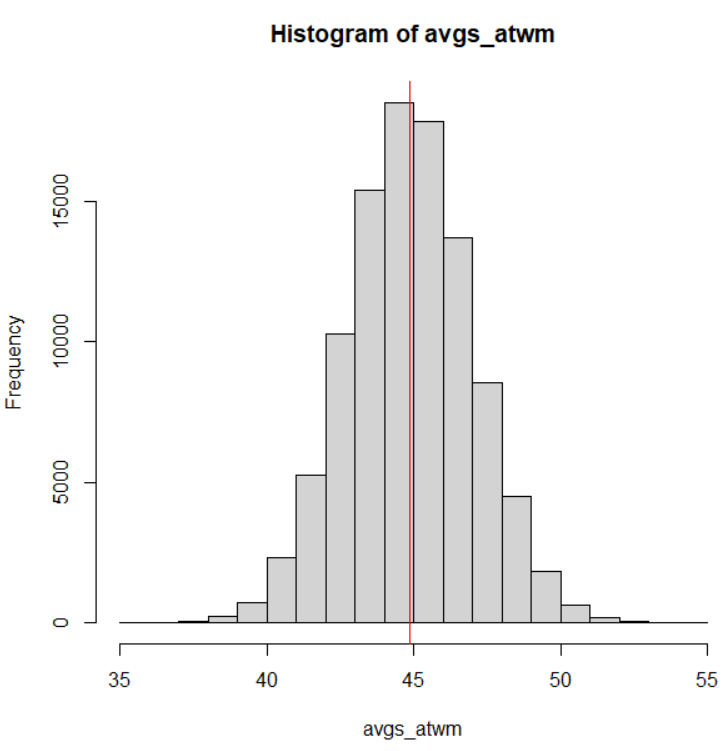
Vertical red line is an average of avgs_atwm.
Then, I use quantile() function to get 2.5% quantile and 97.5% quantile values.
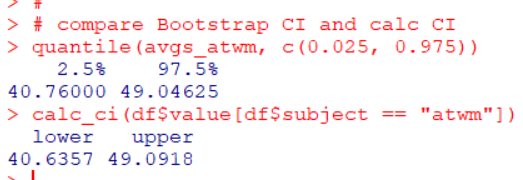
Bootstrap confidence interval is 40.76 ~ 49.04 while standard error confidence interval is 40.64 ~ 49.09. The both are quite similar value.
Next, let's do with "em"; Early Marriage.
Make a histogram.
Let's compare Bootstrap Confidence Interval and Standard Error Confidence Interval.
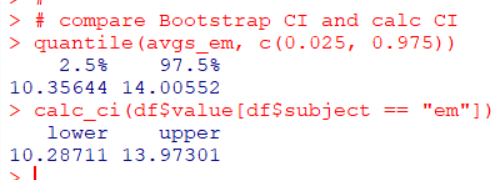
The both CI are quite similar.
That's it. Thank you!
Next post is
To read the first post,