
Photo by Alexander Schimmeck on Unsplash
This post is following of above post.
In this post I will add inflation data into previous post's linear regression model.
Firstly, I will load inflation data. I got the inflation data from OECD web site.
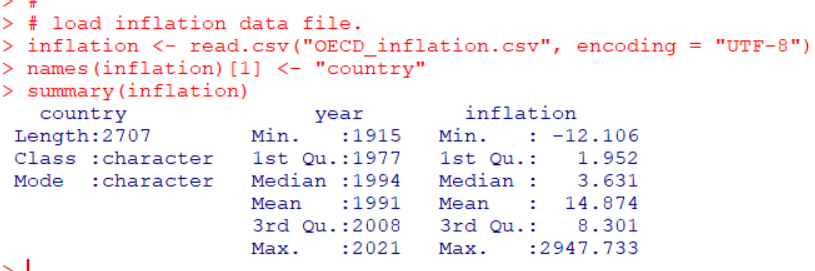
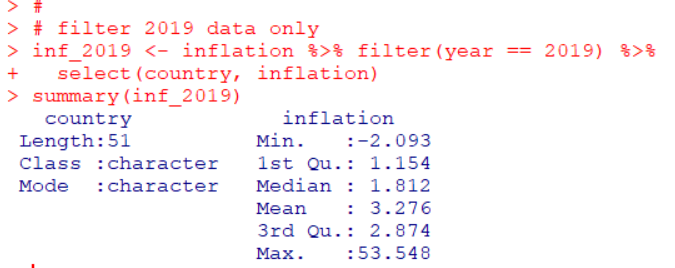
Then, I use only 2019 data.
Then, I merge df3 data frame and inf_2019 data frame.
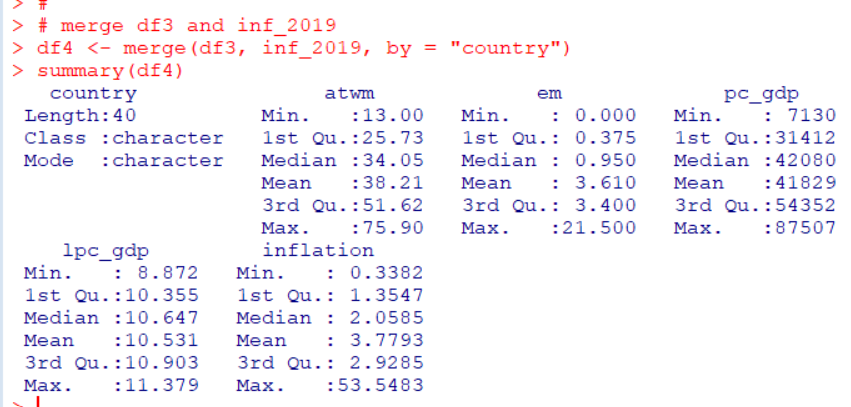
I see minimum inflation is 0.3382 and max is 53.5483, mean is 3.78 and median is 2.06.
Let's check how inflation is distributed.
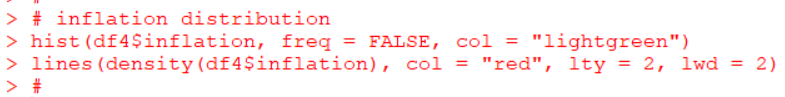
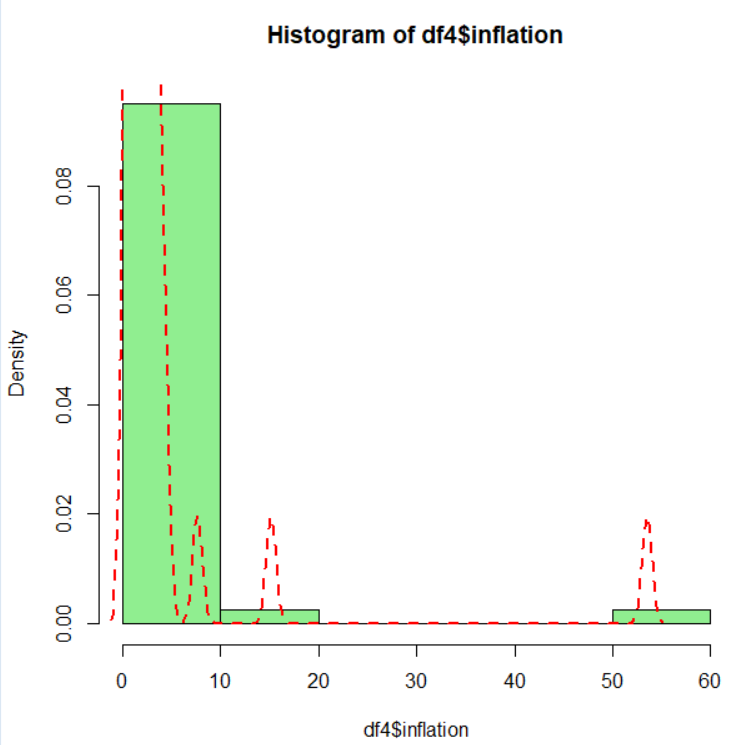
Uhm... It seems better to use log(inflation).
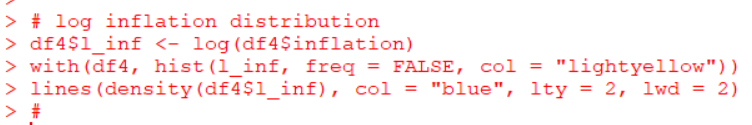
log(inflation) is more normaly distributed than inflation. So I will use l_inf: log(inflation) for linear regression.
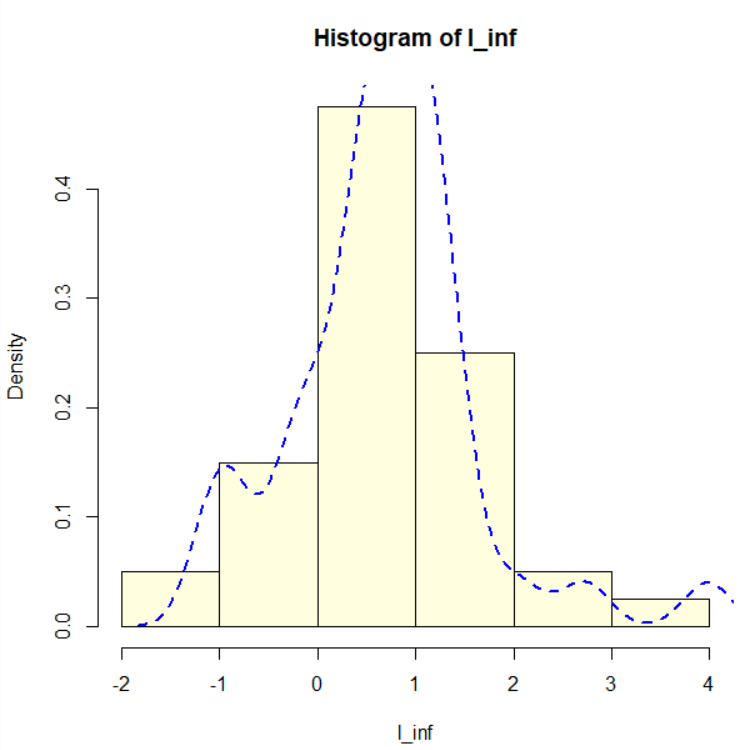
After adding l_inf, atwm and em are still significant variables.
The higher atwm and em, the lower lpc_gdp.
Let's compare previous post's regression model, fit_lm2 and this post's model, fit_lm3.
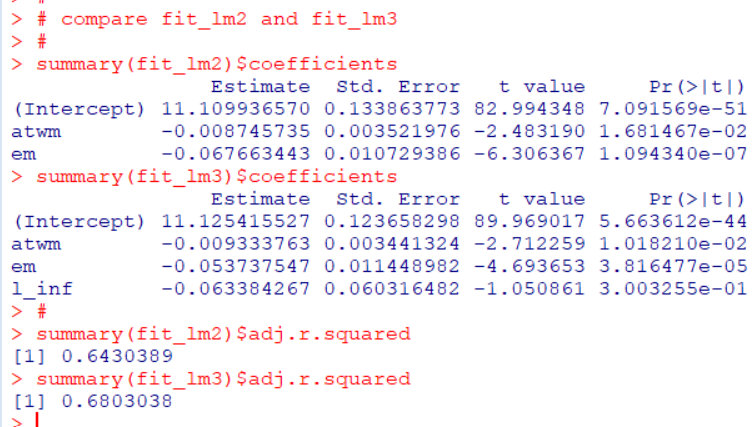
coefficients for atwm and em are very similar value between fit_lm2 and fit_lm3.
That's it. Thank you!
Nxt post is
To read the 1st post,