
In this post, I will analyze OECD Young self-employed data. This is the sare of self-employed aged 20-29 among all employed worksers aged 20-29 in this group.
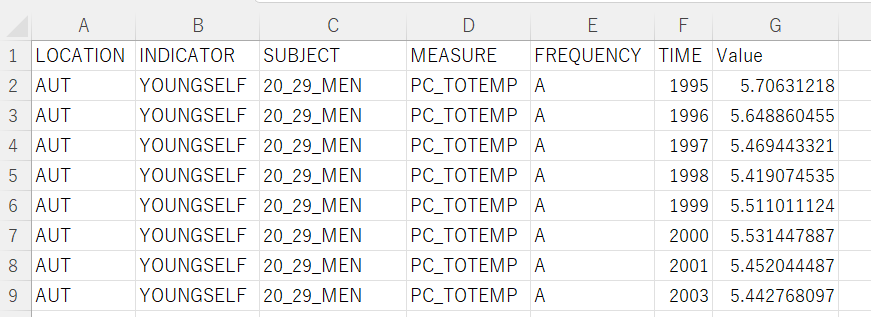
The CSV file which I download from OECD web site is like below.
Let's analyze this data with R.
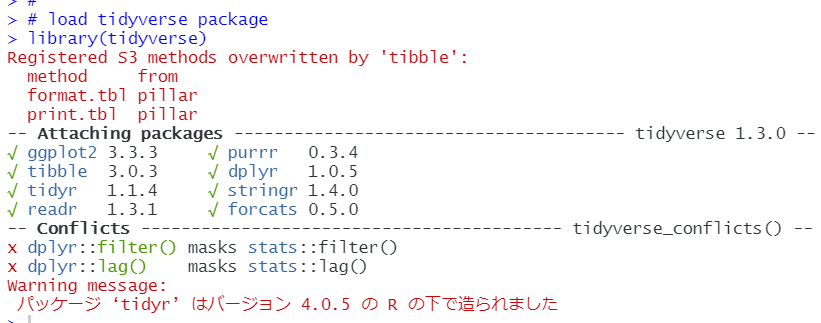
Firstly, I load tidyverse package.
Then, I use read_csv() function to read the CSV file.
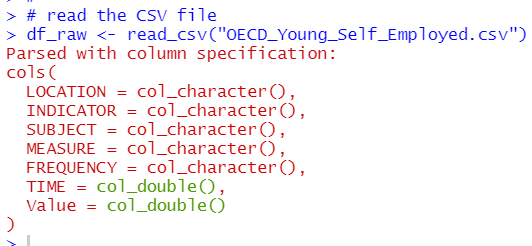
In the CSV file, there are LOCATION, INDICATOR, SUBJECT, MEASURE, FREQUENCy, TIME and Value. Let's check each variables.
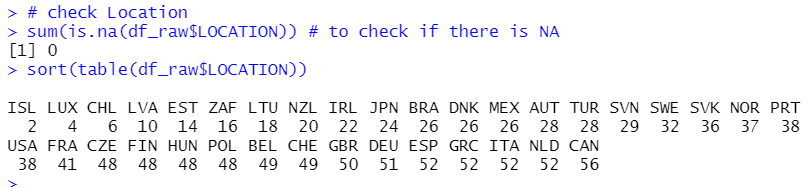
There is not NA for LOCATION and CAN has the most frequent value, 56.
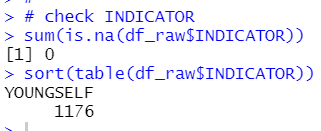
There is not NA for INDICATOR and INDICATOR has only one value, YOUNGSELF. So I can ignore INDICATOR.
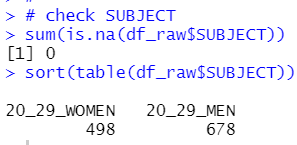
There is not NA for SUBJECT and there are two kinds of value, 20_20_WOMEN and 20_29_MEN. I will change it women and men later.
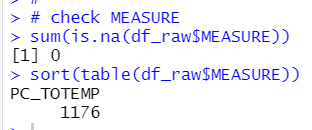
There is not NA for MEASURE and there is only one value, PC_TOTEMP. So I can ignore this.
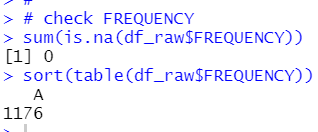
There is not NA for FREQUENCY and there is only one value, A, so I can ignore this.
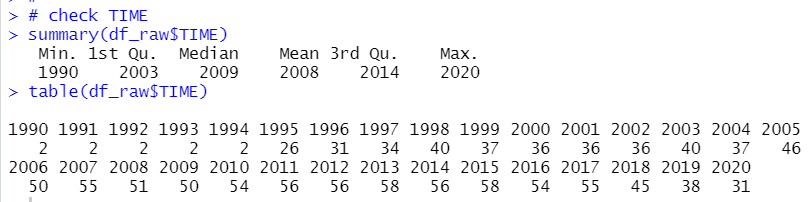
There is not NA for TIME. 2013 and 2015 has the largest observations, 58.
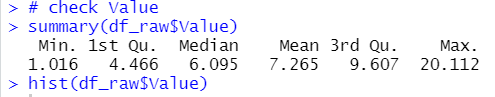
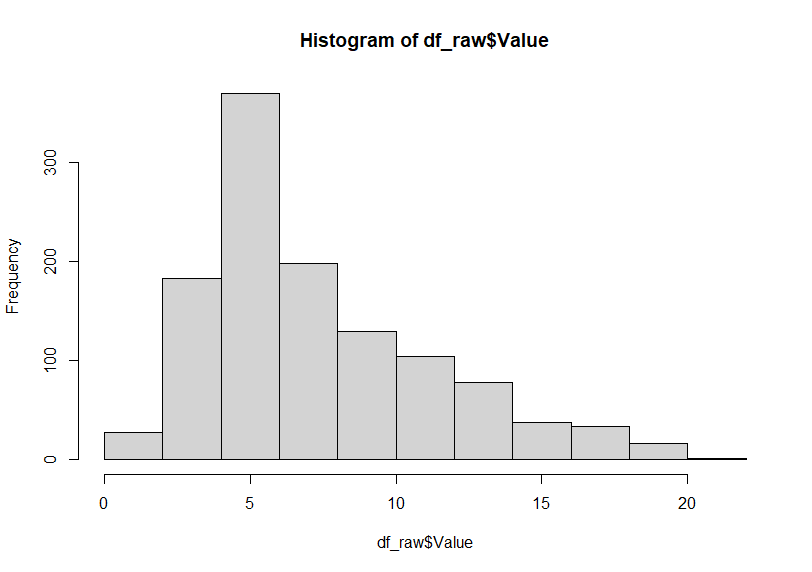
There is not NA for Value and Value is distributed right skewed.
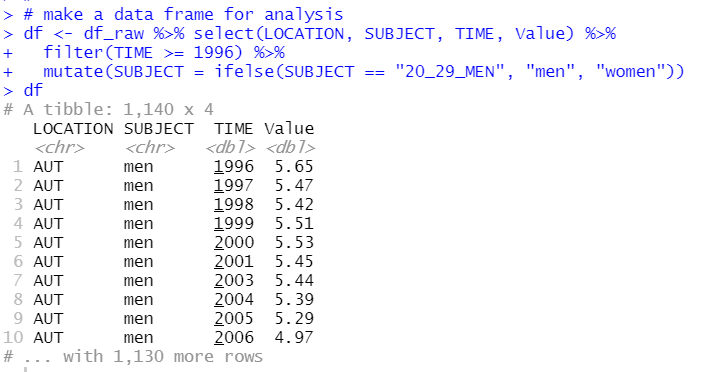
Now, I will make data frame for analysis. I will delete INDICATOR, MAJOR and FREQUENCY, I will use TIME which has more than 30 LOCATIONs only , it meand from 1996 and I will change SUBJECT value to women and men.
That's it today.
Thank you!
Tne next post is