
Photo by Colin Watts on Unsplash
This post is following of above post.
In the above post, I made panel data set.
Let's analyze with the panel data.
Firstly, I male year dummy variable.
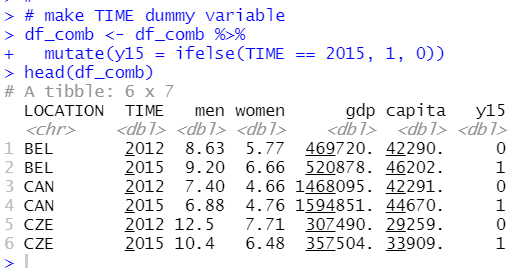
y15 is 1 when TIME is 2015 and 0 when TIME is 2012.
Then, I made pooling cross section regression.
My first model is men = beta_0 + beta_1 * capita + beta_2 * y15 + u
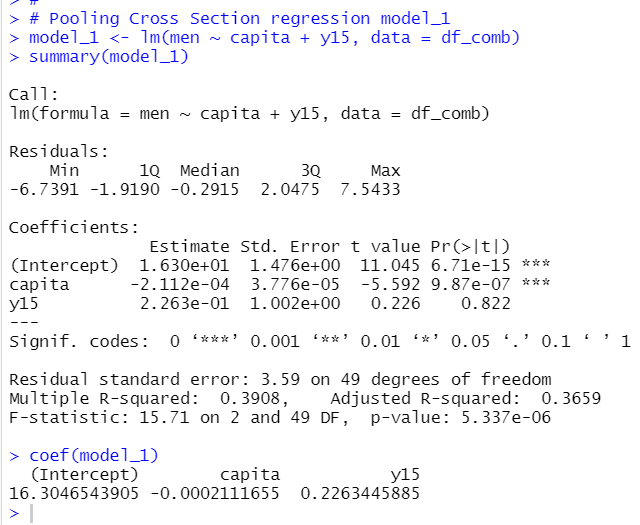
capita is in 1 USD, so, model_1 suggest that 1 USD increase of capita makes men lower by -0.0002222655%. It is a bit difficult to understand.
So, I made capi10K, that is capita in 10K, 10,000 USD.
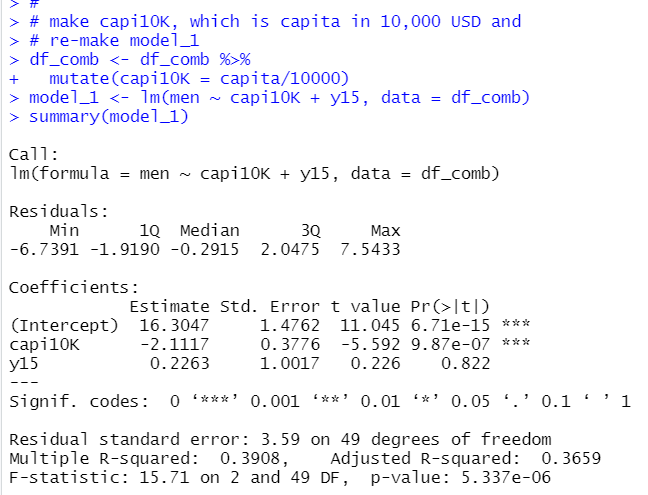
The summary() function result is more easy to understand.
10,000 USD per capita increase means -2.1117 percent point decrese for men young self-empolyed.
Let's make a scatter plot.
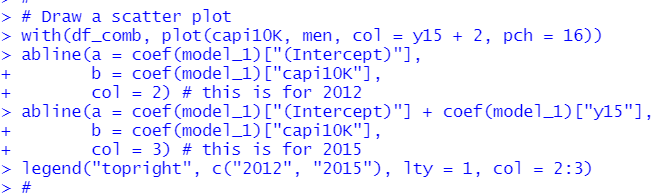
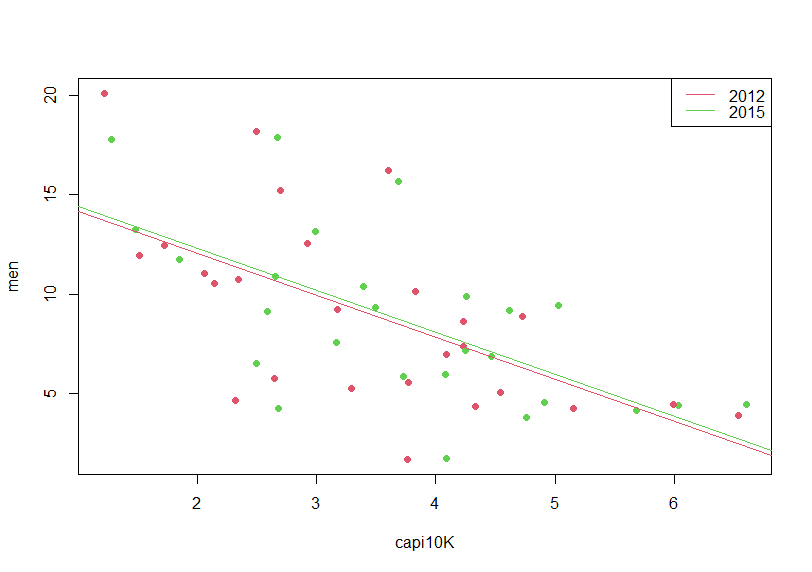
I don't see large difference between 2012 and 2015.
Next, let's add interaction term.
men = beta_0 + beta_1 * capi10K + beta_2 * y15 + beta_3 * capi10K * y15 + u
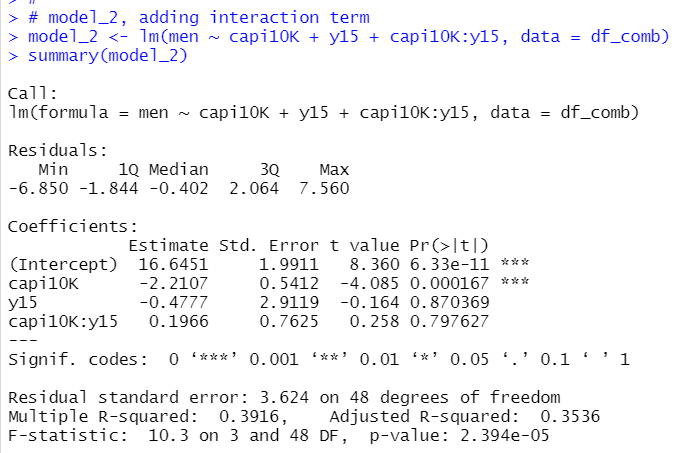
So, when TIME is 2015, y15 = 1, so the model is
men = 16.6451 - 0.4777 + (-2.2107 + 0.1966) * capi10K + u
When TIME is 2012, t15 = 0, the model is
men = 16.6451 -2.2107 * capi10K + u
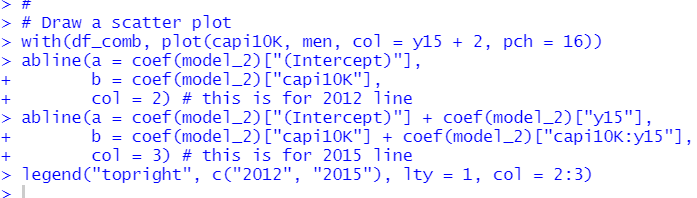
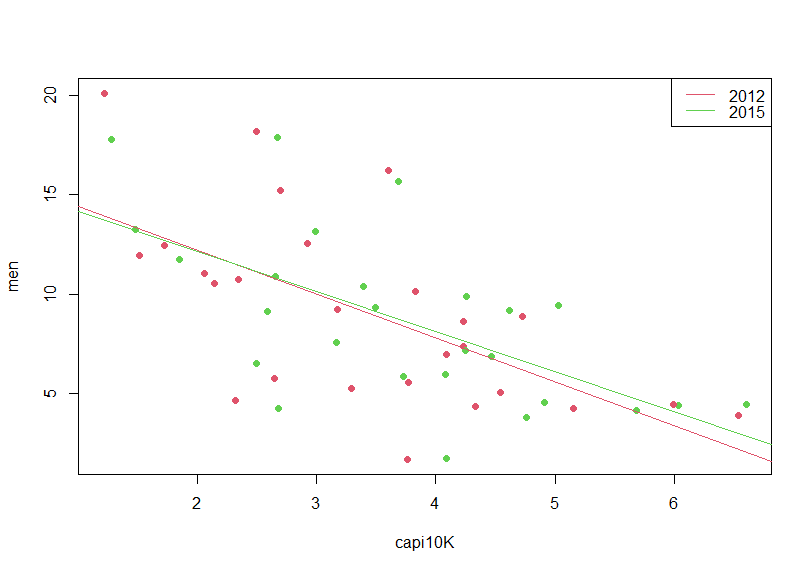
Let's draw a scatter plot.
Next, I use 1/capi10K instead of capi10K.
men = beta_0 + beta_1 * (1/capi10K) + beta_2 * y15 + u
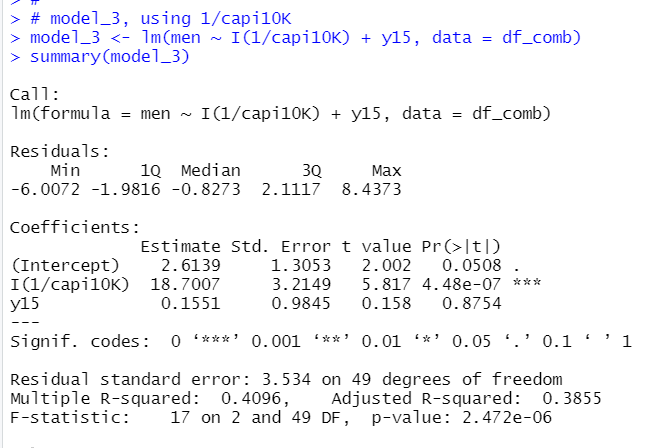
I(1/capi10K) coefficient is 18.7. so 1 inclease of 1/capi10K makes 18.7 increase of men.
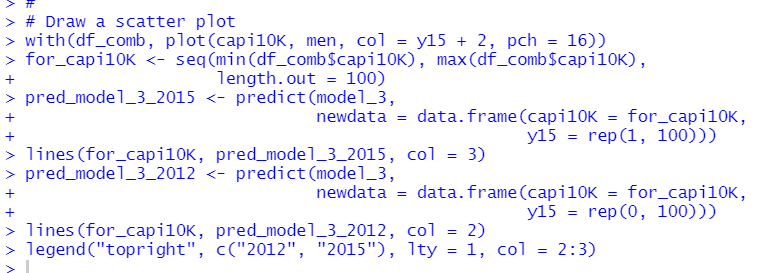
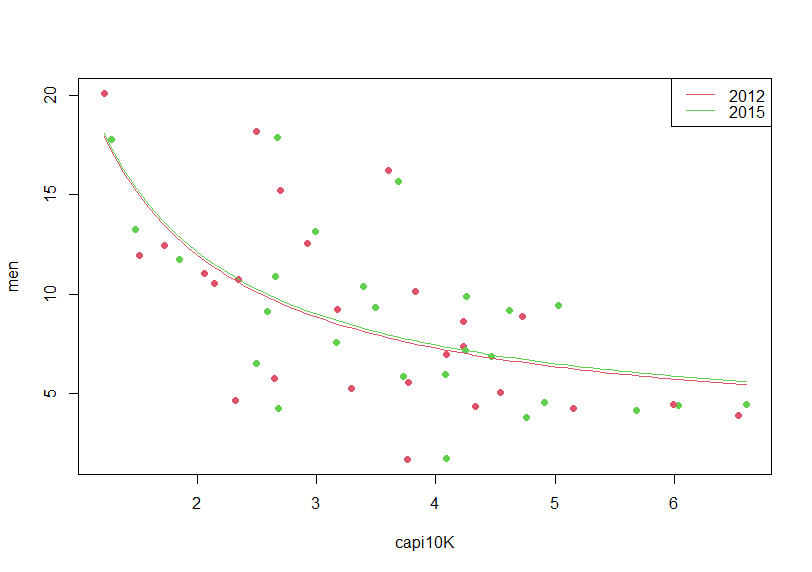
Let's make a sacatter plot
Finally, let's compare three models with stargazer package's stargazer() function.
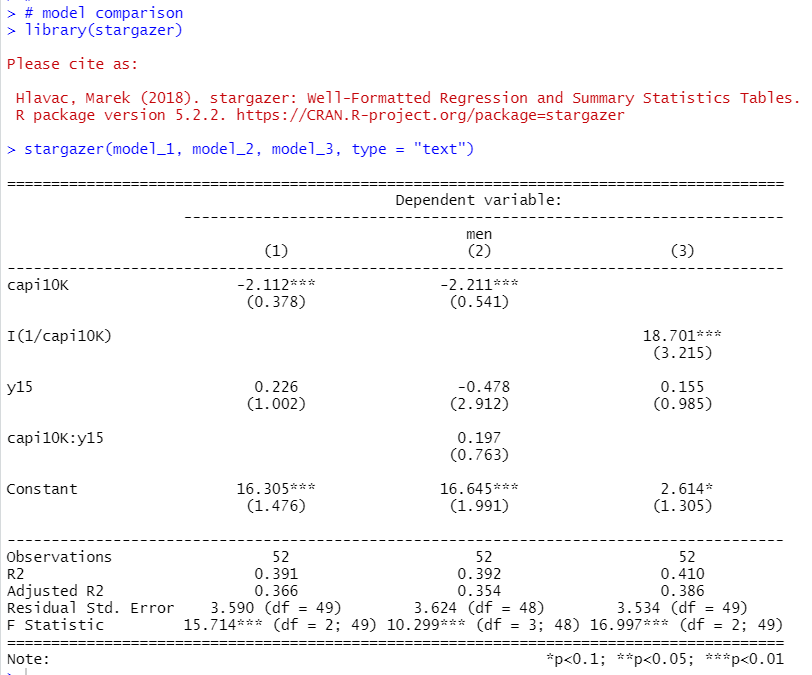
That's it. Thank you!
Next post is
To read the 1st post,