
Photo by Erda Estremera on Unsplash
This post is following of above post.
Let's make two scatter plots and display them in a panel.
Firstly, I load gridExtra package.
![]()
Then, I make two objects, each object is for a scatter plot.
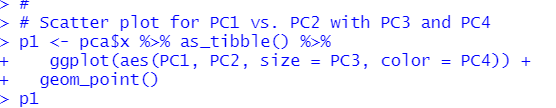
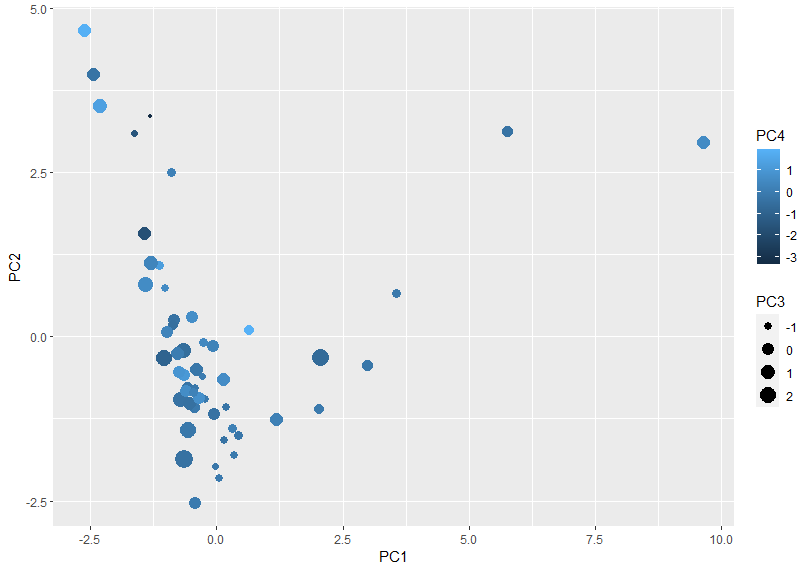
p1 object is like above.
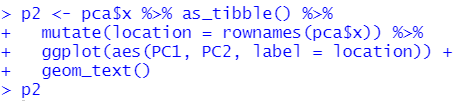
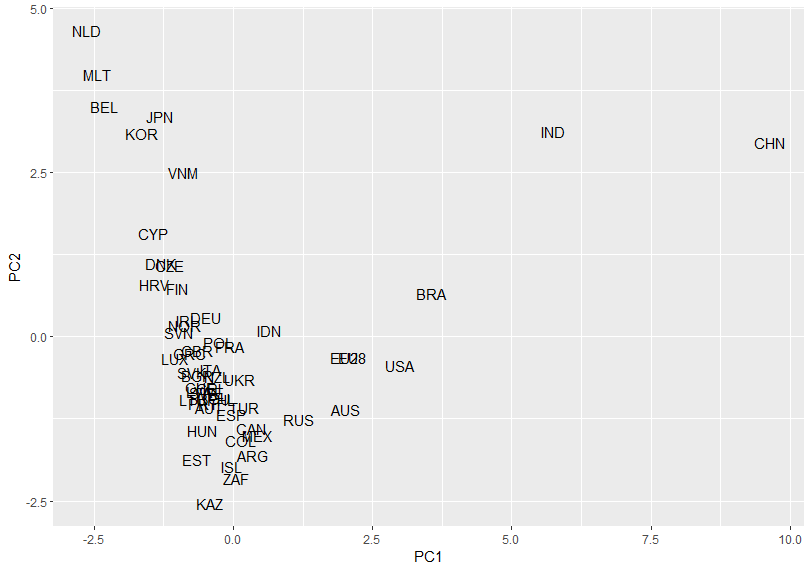
p2 object is like above.
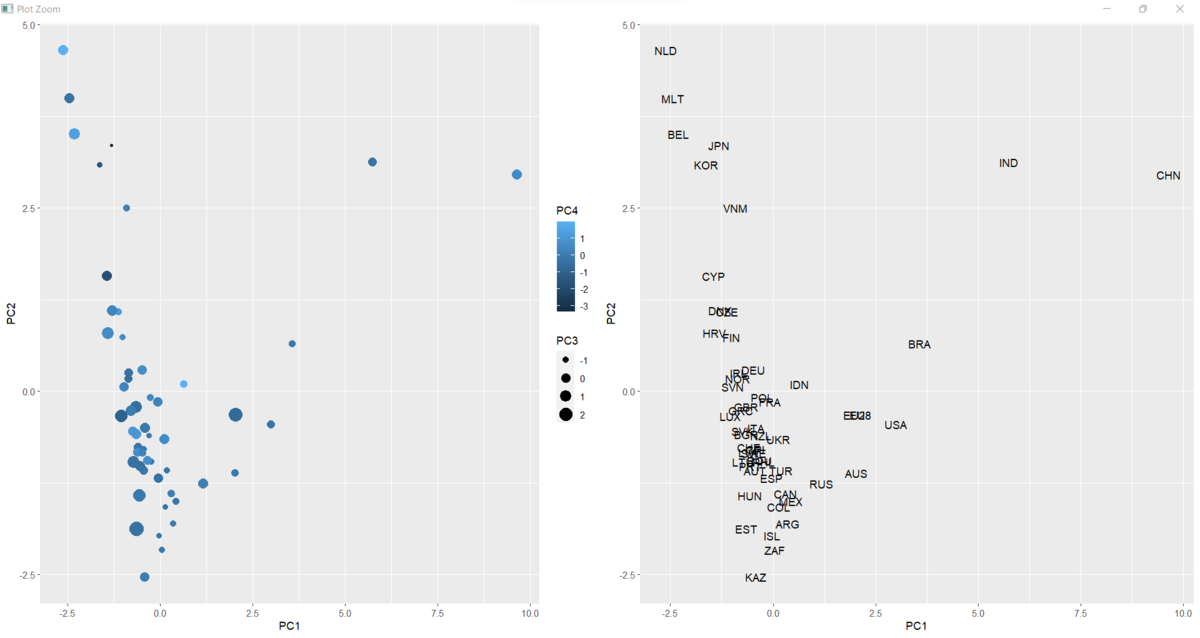
Then, I use grid.arrange() function.
![]()
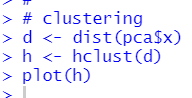
Next, let's do hierarchial culstering. I use dist(), hsclust() and plot() function.

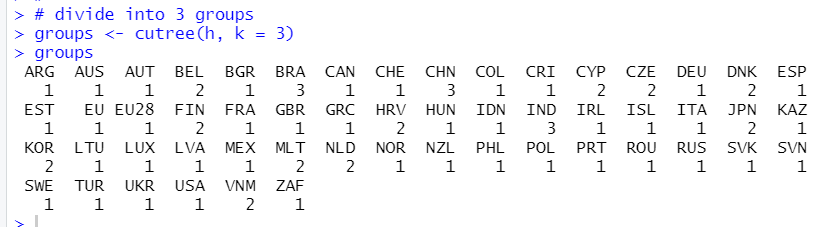
I see there are three clusters, one is CHN, BRA and IND, the other is JPN, CYP, KOR, MLT, BEL, NLD, DNK, HRV, VNM, CZE and FIN, and thr 3rd cluster is the rest.
Let's divide locations into three groups usung cutree() function.
Let's visualize it.
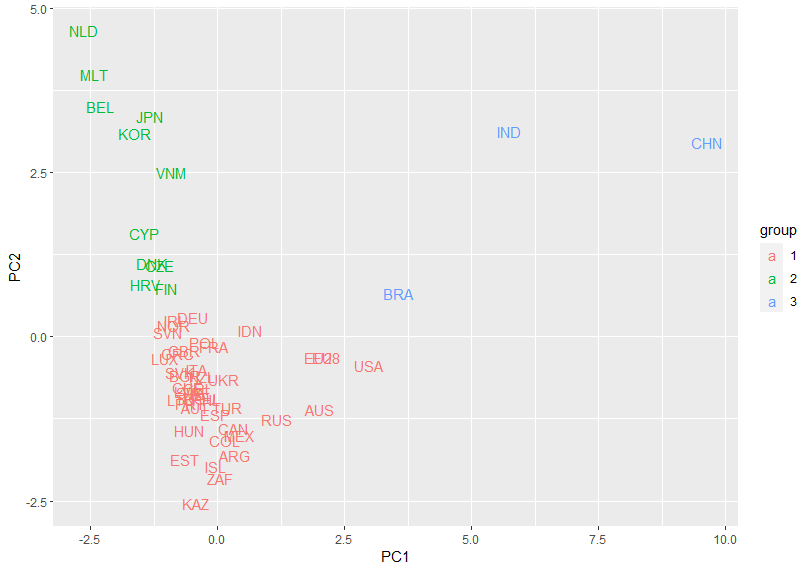
You see PC1 and PC2 are good for clustering.
That's it. Thank you!
Next post is
To read from the 1st post,