
Photo by Philip Myrtorp on Unsplash
This post is following of above post.
Since I made several objects, let me confirm what objects there is.
ls() function shows current object list.
So far, I have df_raw, df1, df2 and df3 for data frame.
gimpse() function is useful for what variables a data frame has.
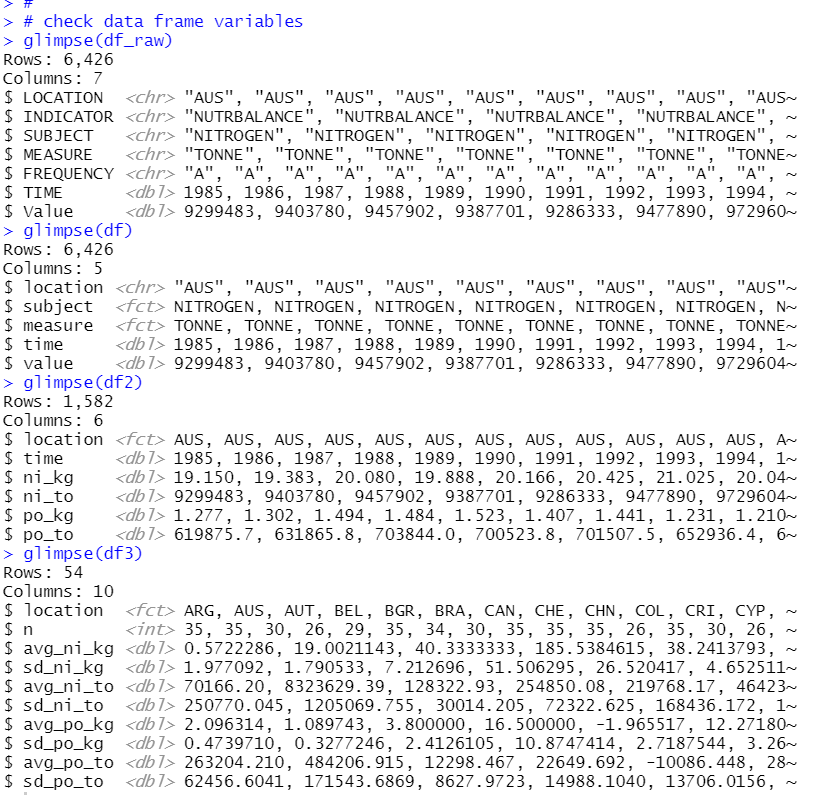
df2 is like apanel data, so I will make panel data frame with plm packages's pdata.frame() function.
Firstly, I check how many observations each time has.
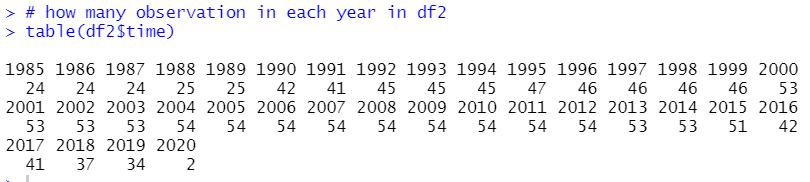
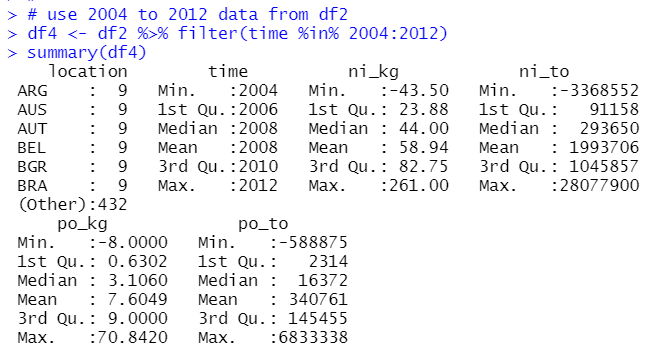
From 2004 to 2012, there are 54 observations. So, I will use only from 2004 to 2012 data to make a panel data.
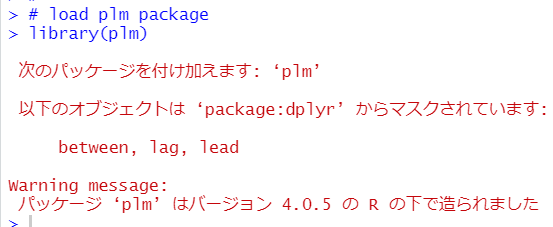
Then, I load plm package.
Next, I use pdata.frame to make a panel data frame from df4.
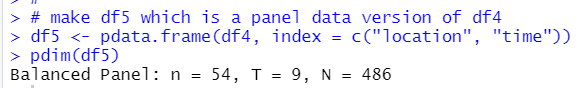
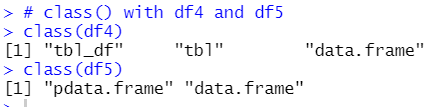
All right. df 4 and df5 have the same data, but df4 is simple data frame while df5 is a panel data.
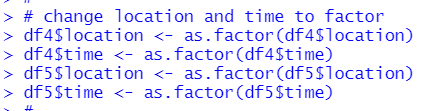
I want to do regression analysis with df4 or df5 data, so I will change location and time to factor type.
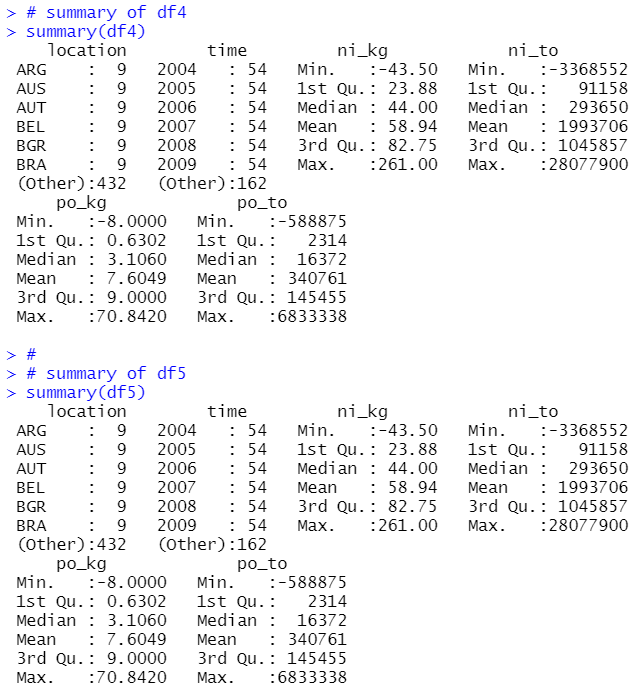
Let's see summary for df4 and df5
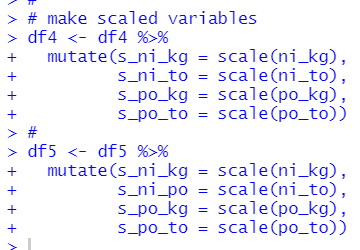
Since ni_kg and ni_to, po_kg and po_to are very different value leve, I make scaled variables with scale() function
Again, let's see summary of df4 and df5.
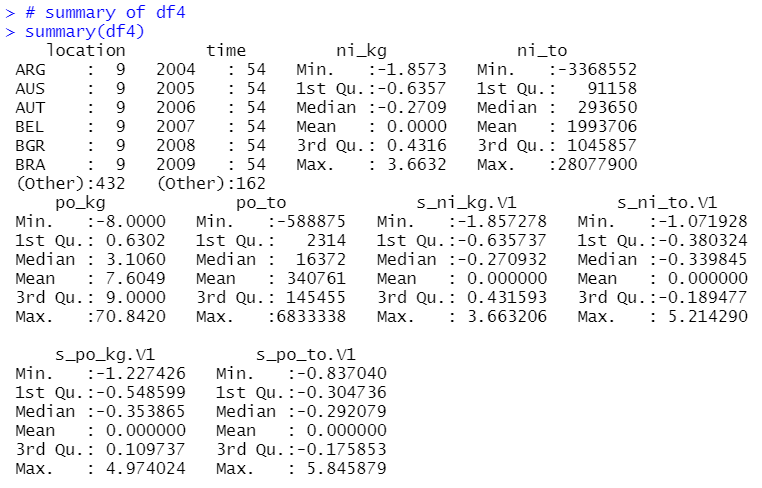
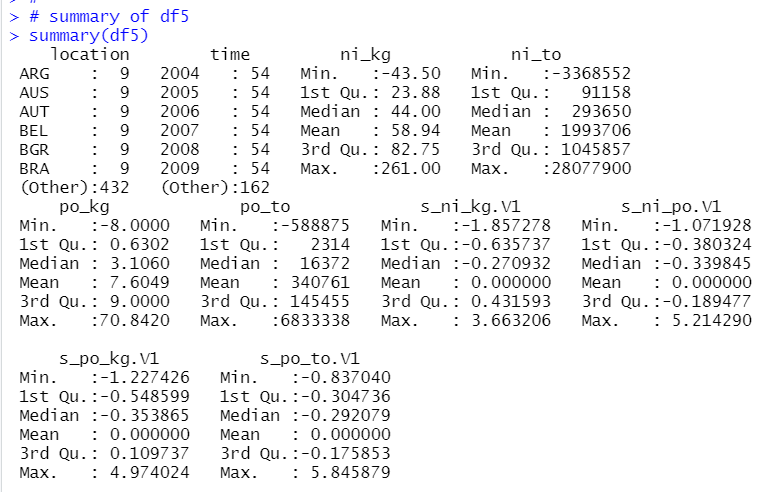
Scaled variables are mean 0 and standard deviation 1.
That's it. Thank you!
The next post is
To read from the 1st post,