
UnsplashのArda Demirkaynakが撮影した写真
This post is following of above post. In the previous post, I made some visualizations with R ggplot2 package. In this post. In this post I will calculate confidence intervals.
Firstly, let's see average value of variables.
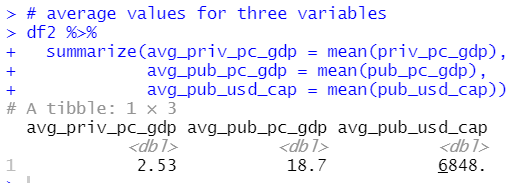
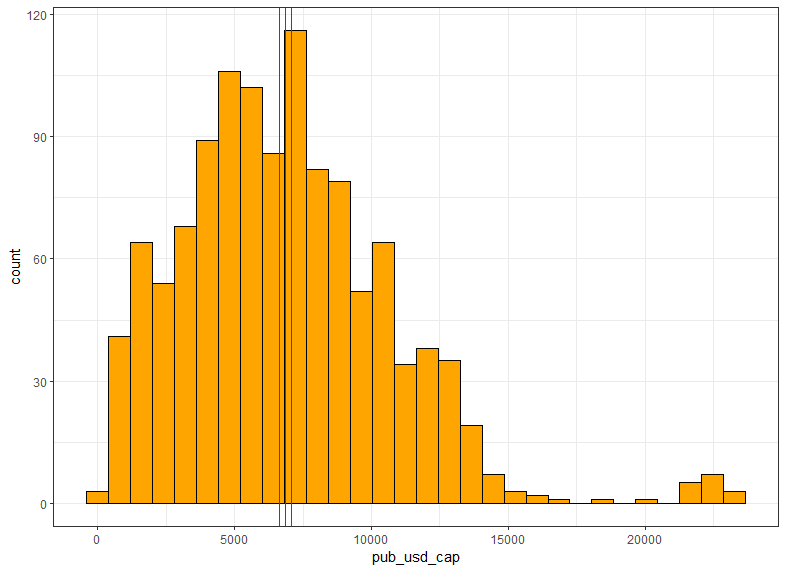
I see average priv_pc_gdp is 2.53, average pub_pc_gdp is 18.7 and average pub_usd_cap is 6848.
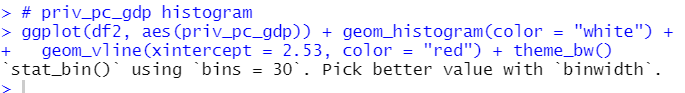
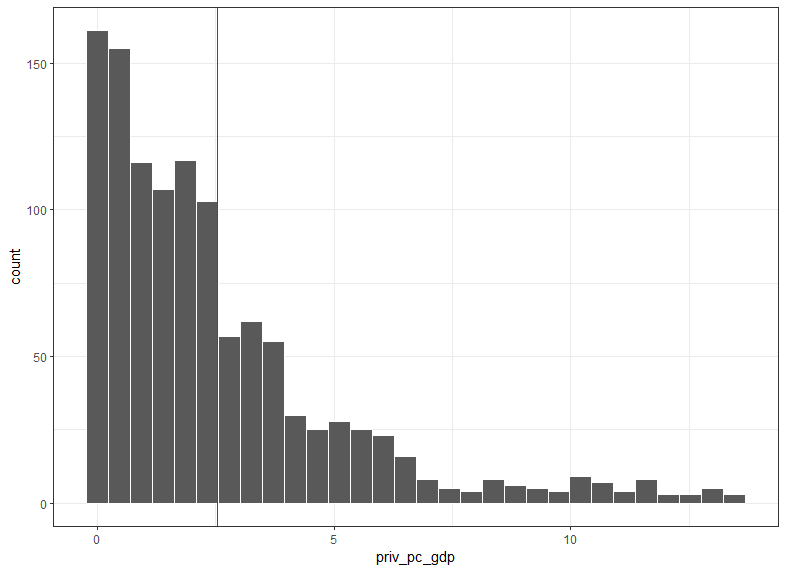
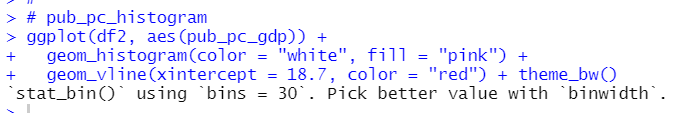
Let's see histograms with average value.
priv_pc_gdp
pub_pc_gdp

pub_usd_cap
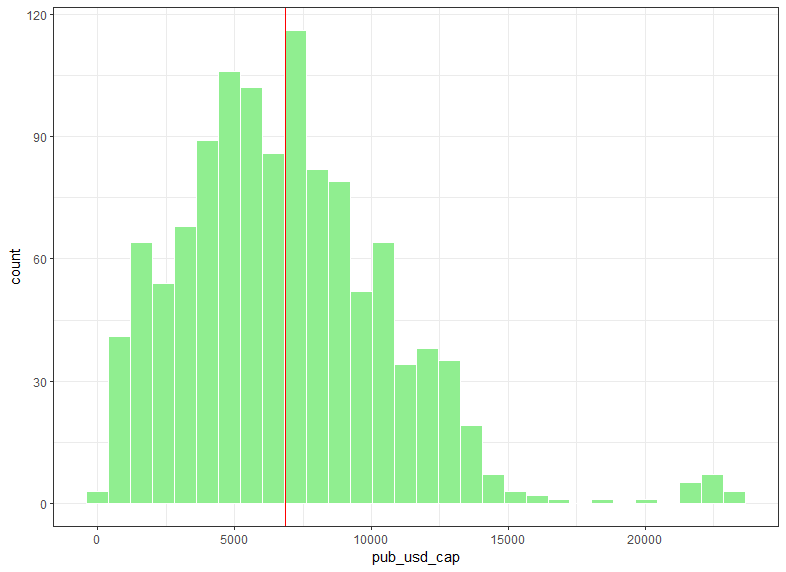
I see priv_pc_gdp is the most skewed variable among those three.
To calclate confidence interval, we need standard error, which is standard deviation / sqrt(number of observations).
Let's caluclate them.
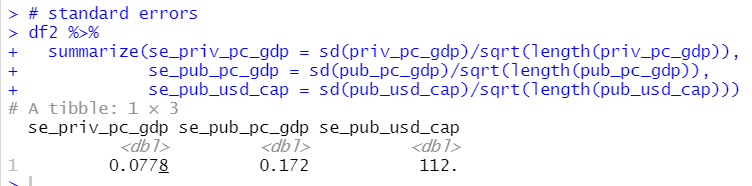
So, standard error of priv_pc_gdp is 0.0778, standard error of pub_pc_gdp is 0.172 and standard error of pub_usd_cap is 112.
All right, I can calculate confidence intarval. 95% confidence interval is calculated as followings. average value -/+ 1.96*standard error.
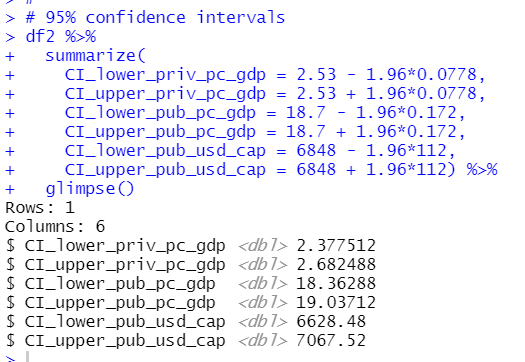
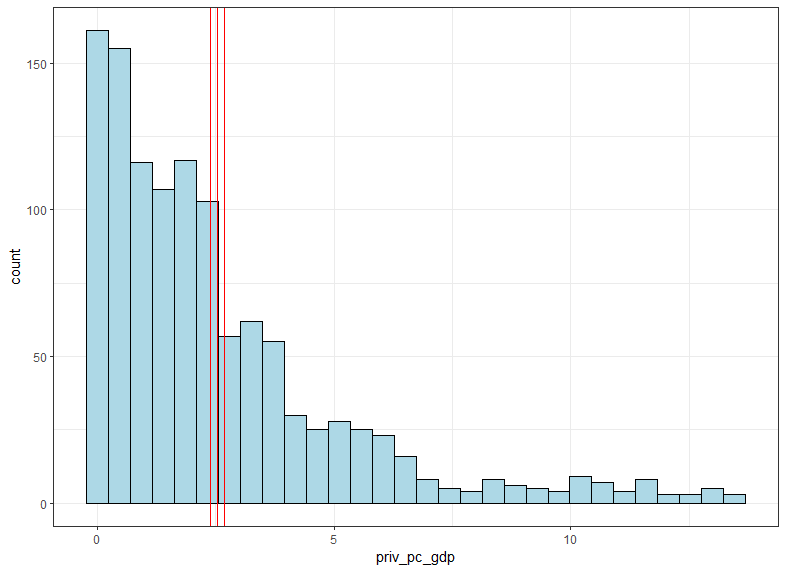
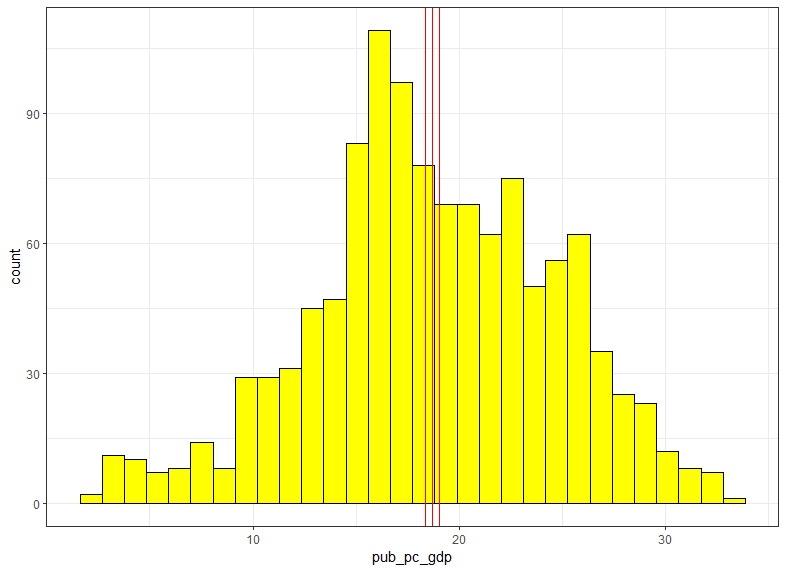
So, 95% confidence interval for priv_pc_gdp is [2.378, 2.682], 95% confidence interval for pub_pc_gdp is [18.36, 10.04] and 95% confidence interval for pub_usd _cap is [6628, 7067].
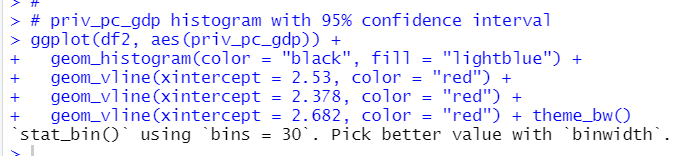
Let's add confidence intervals to previous histograms.
priv_pc_gdp:
pub_pc_gdp:
pub_usd_cap:
That's it. Thank you!
The next post is,
To read from the 1st post,