
UnsplashのSonika Agarwalが撮影した写真
This post is following of the above post.
In this post, I will do bootstrapping with R infer package.
Suppoese df2$priv_pc_gdp is population. So true mean of priv_pc_gdp is
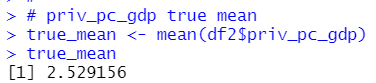
The true mean is 2.529156.
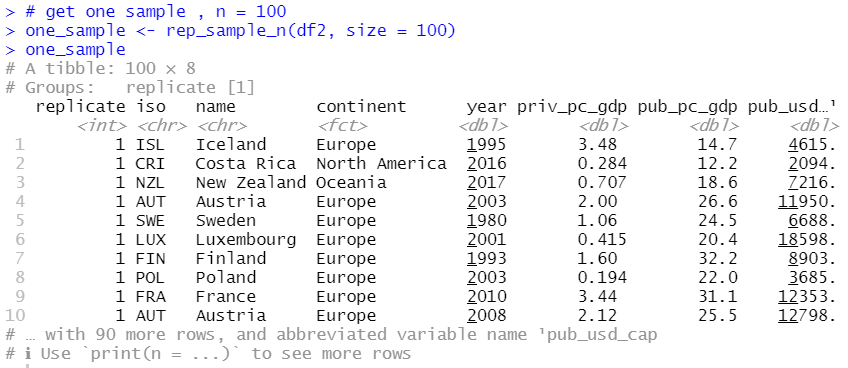
Supoese I draw 100 observations from df2 dataframe, so my sample size is 100.
Let's calculate my sample: one_sample's mean of priv_pc_gdp.
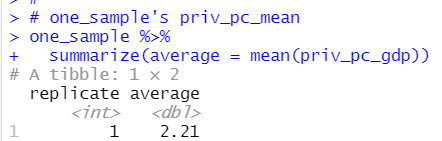
My sample's priv_pc_gdp mean is 2.21.
Now, let's use R infer package to get confidence intervals with my sample: one_sample.
Firstly, I "specify" my interesting variable, it is priv_pc_gdp.
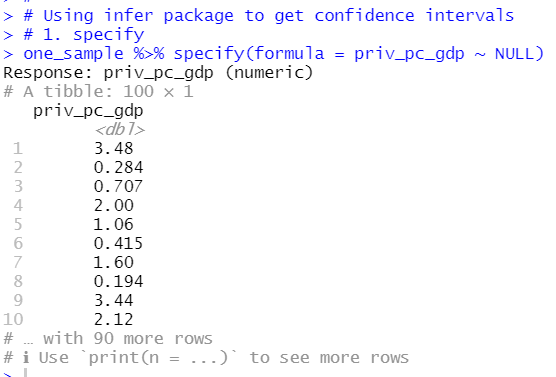
infer package's specify() function specify my ineresting variable: priv_pc_gdp.
You see "Response: priv_pc_gdp(numeric).
Second, generate replicates.
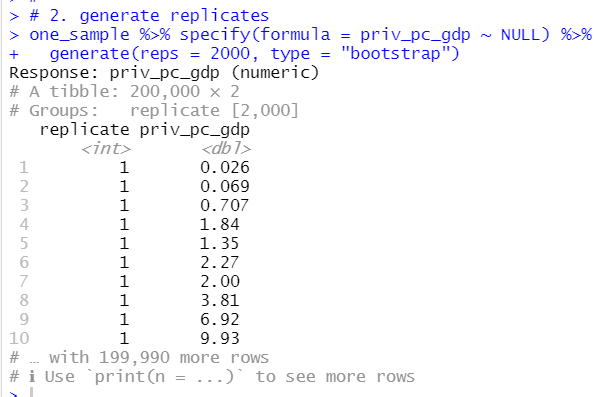
infer package's generate() functions makes bootstrap sampling replication. I set reps = 2000, it means 2000 replication.
We see Groups: replicate[2,000]
Third, caluculate summary statistics
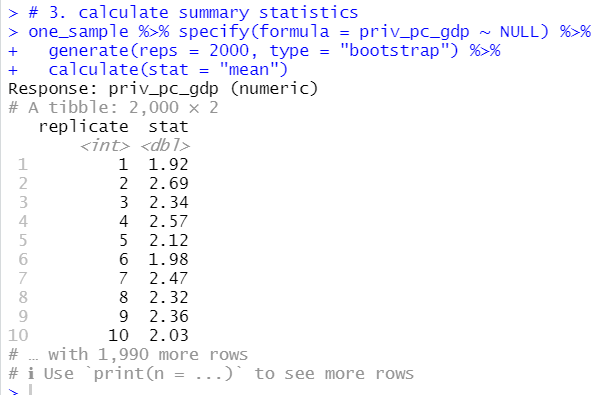
infer package's calculate() functions gets summary statistics. In this case, stat = "mean" is for calculating mean.
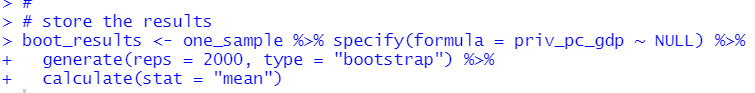
I store the result as boot_results.
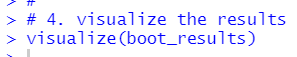
Forth, visualize the results distribution with infer's visualize() function.
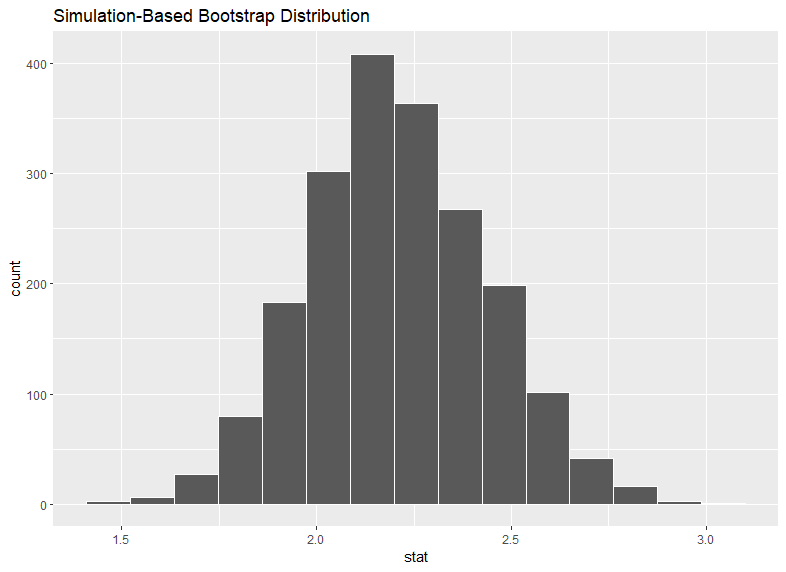
Then, I can calculate confidence intervals with infer's get_confidence_interval(9 function.
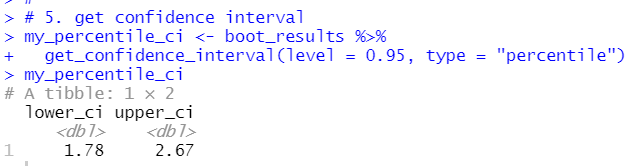
percentile method 95% confidence intervals is 1.78 ~ 2.67.
Since, boot_results distribution is like normal distribution, I can use standard error type confidence interval.
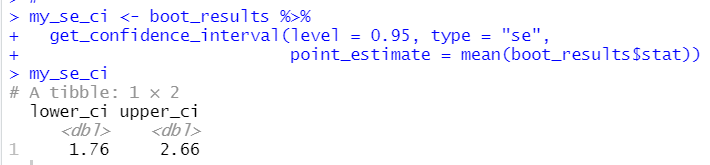
standard error method confidence interval is from 1.76 to 2.66, it is very close to percentile method confidence interval.
Lastly, let's visialize confidence interval with shade_confidence_intervals() function.
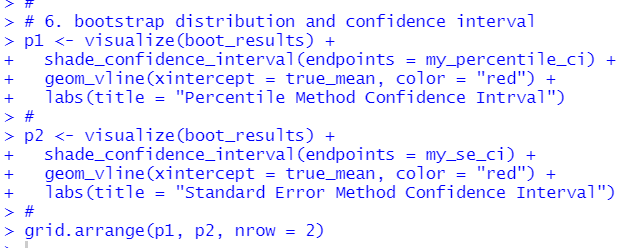
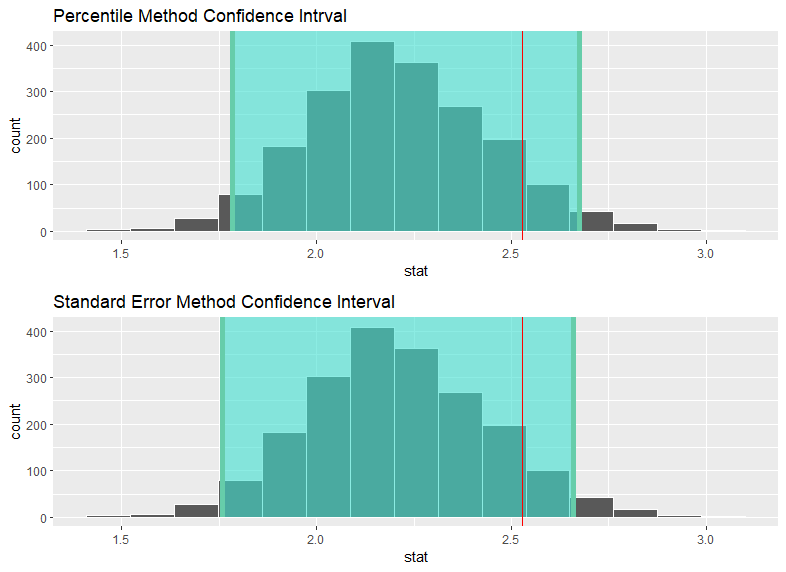
Red vertical line indicates true mean, 2.529156.
So the both confidence intervals include true mean.
That's it. Thank you!
Next post is
To read the 1st post,