
UnsplashのWaranont (Joe)が撮影した写真
This post is following of the above post.
In this post I will do linear regression anaysis using R.
Firstly, I will start with one numerical explanatory variable.

Above code shows that explanatory variable id pub_pc_gdp and explained variable is priv_pc_gdp.
Let's see the results with get_regression_table() function and get_regression_summaries() function, the both functions are in moderndive package.
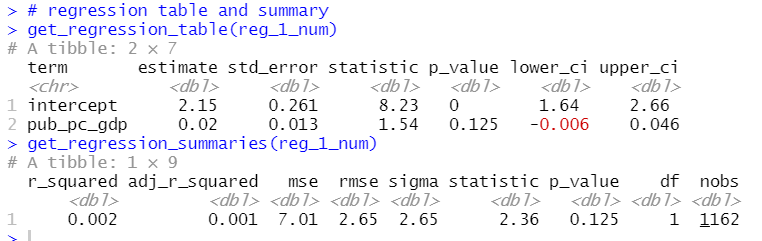
pub_pc_gdp's coefficient estimate is 0.02 but lower_ci and upper_ci includes 0, so this implied it is not statistically significant at 95% level.
Next, I use one categorical variable as explanatory variable, it is continent.

Let's see the results.
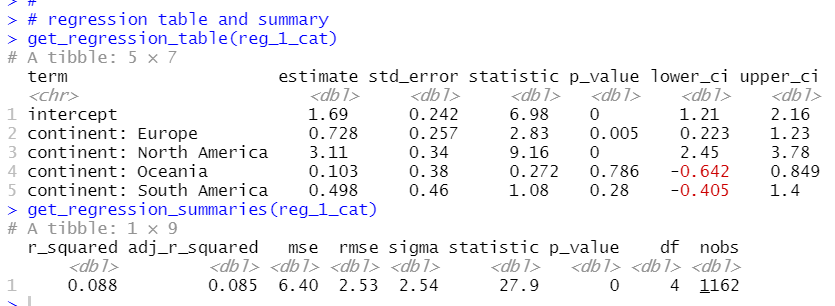
Since there is not Asia in the regression table, base continent is Asia. Asia's mean priv_pc_gdp is 1.69 and North America's mean priv_pc_gdp is higer than Asia's mean by 3.11 and it is statistically significant. In addition, Europe's mean is higher than Asia's mean by 0.728 and it is statistically significant.
Next, I use one numerical variable and one categorical variable.

Let's see the results.
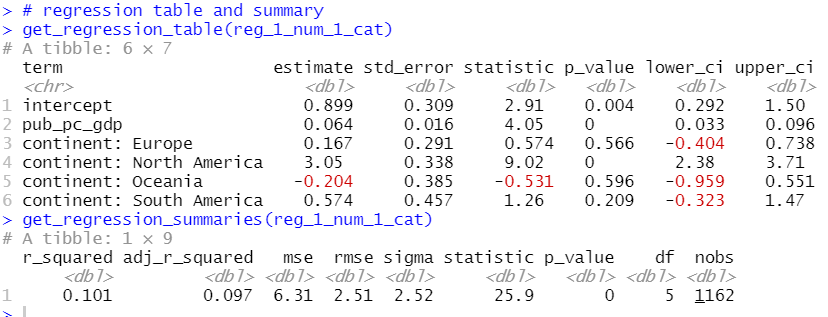
When adding continent, pub_pc_gdp becomes statistically significant variable. Europe is no longer statistically significant but North America is still siginificant.
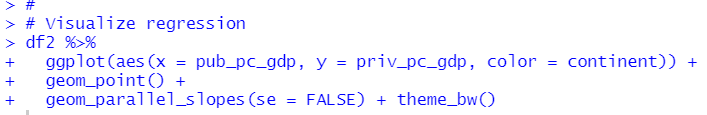
moderndive package's geom_parallel_slope() function can add regression line.
Next, I add interaction terms. It means multiple slopes.
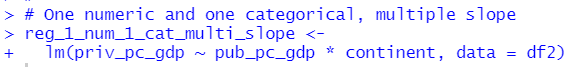
pub_pc_gdp * continent makes multiple slopes.
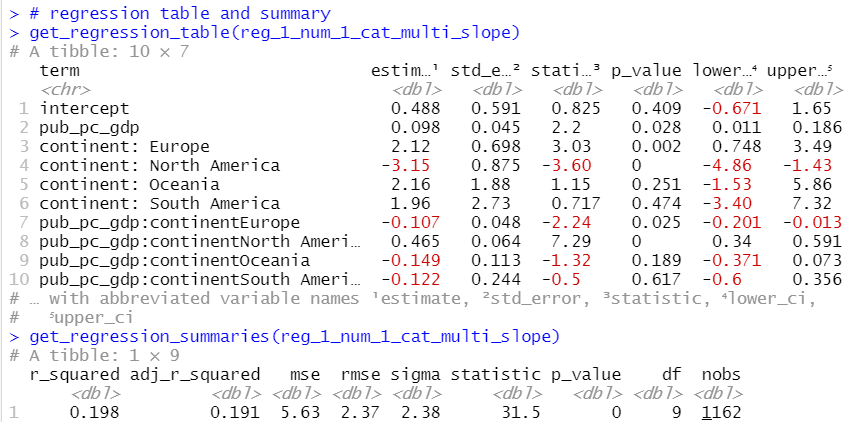
Let's see the results.
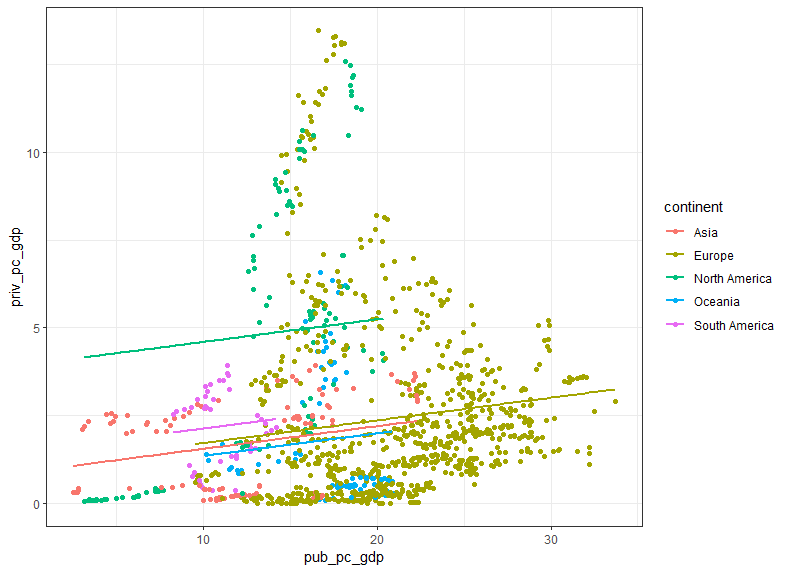
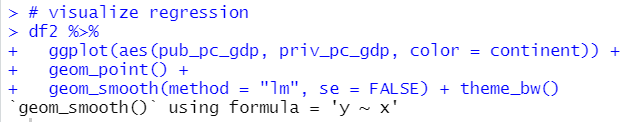
Visualize the results.
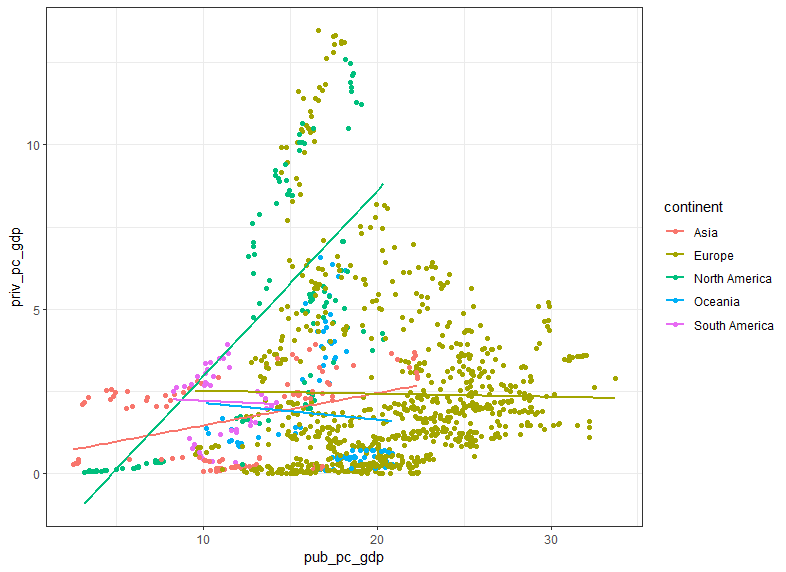
I see North Amarica and Asia have positive slopes and Europe, Oceania and South America have negative slopes.
That's it. Thank you!
To read from the first post,