
This post is following of the above post.
In this post I do hypothesis testing using R with infer package.
I refere to B Inference Examples | Statistical Inference via Data Science (moderndive.com)
Let's go.
Firstly I set Null hypothesis and Alternative hypothesis as follows.
Null: avaerage number of nuclear power plant is 31.
Alternative: average number of nuclear power plant is less than 31.
And I set alpha = 0.5%.
So, Null: mu = 31, Alternative: mu < 31, alpha = 0.05.
All right, let's use R.
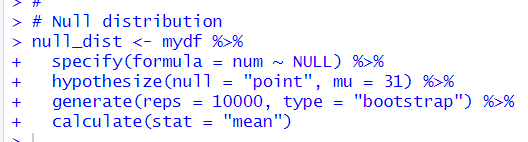
I make null distribution.
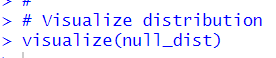
Then, I visualize this distribution.
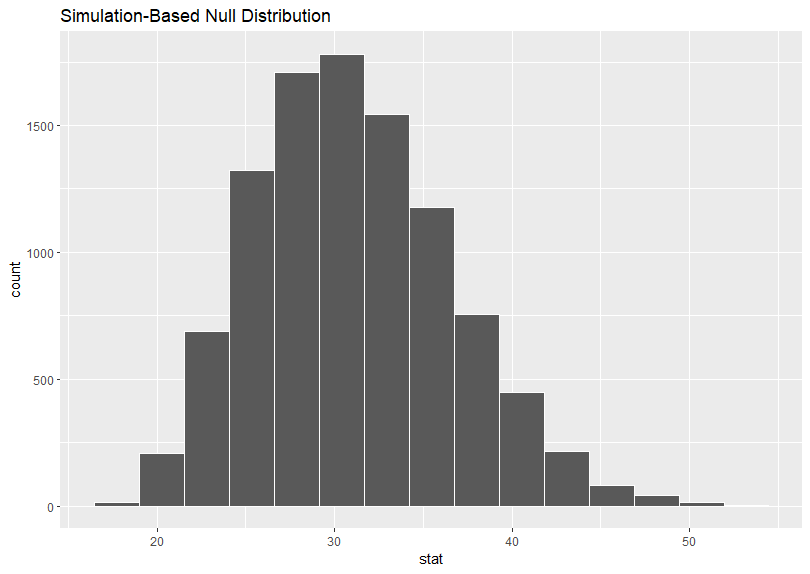
To comapre this distribution with observed average, I calculate observed average.
Then, let's see our p-value.
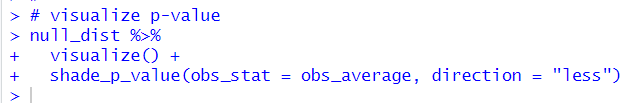
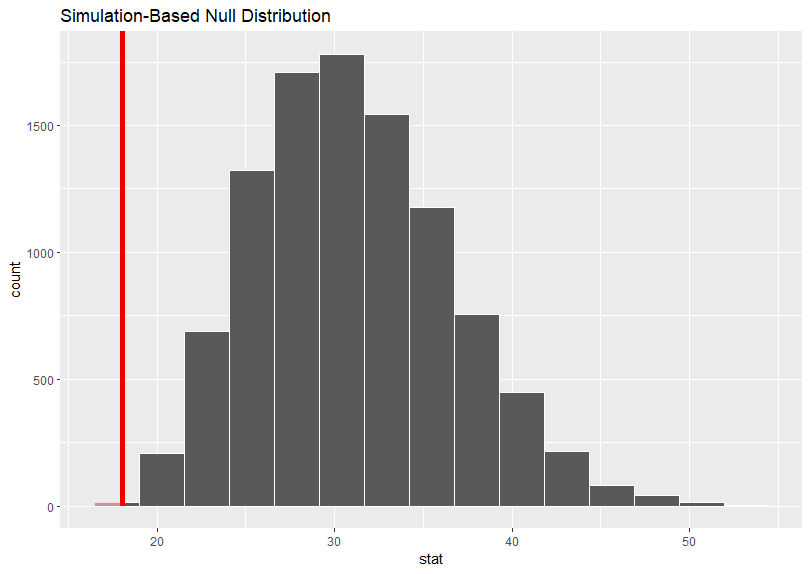
The red vertical line is observed average line.
Let's calculate p-value.
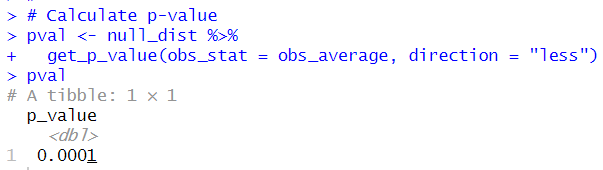
p-value is 0.001 and I set alpha = 0.05, so I can reject Null hypothesis: average number of nuclear power plants is 31 at the 5% level..
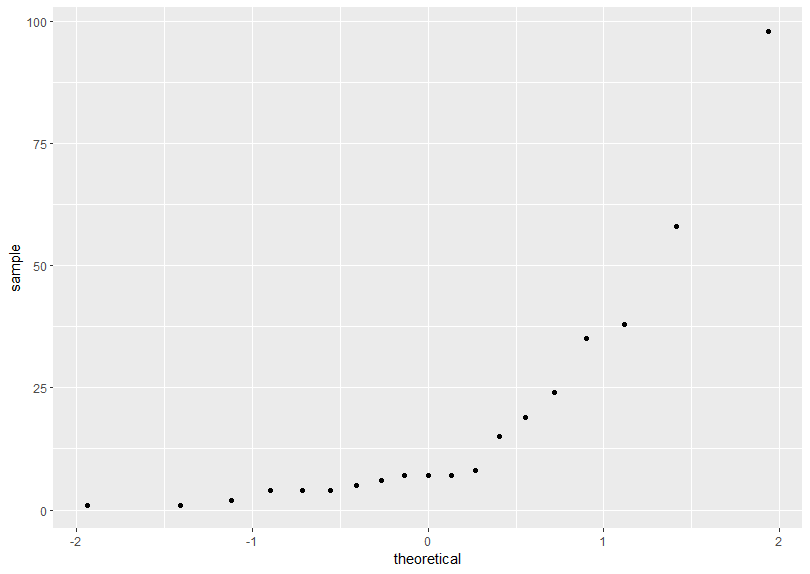
Our sample size is only 19, so I cannot use traditional(formula base) hypothesis testing.
And Q-Q plot is not showing normal distribution.
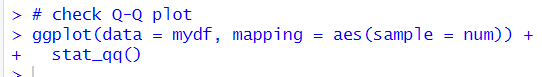
Anyway, I just use t.test() function and t_test() function to do traditional(formula based) hypothesis testing.
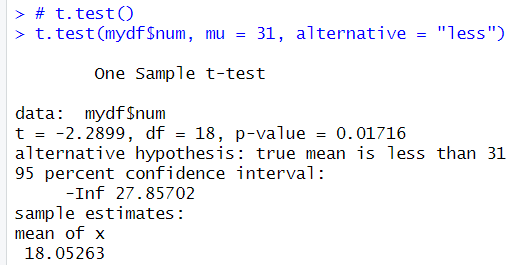
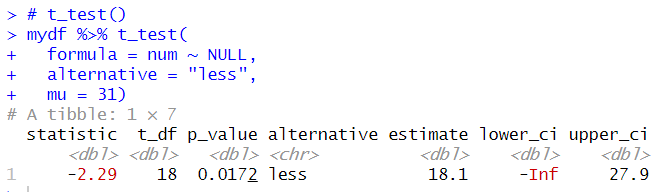
The both t.test()and t_test() returns same p-value, 0.0172, it is greater than bootstrapped p-value: 0.0001.
So, I am more confident with bootstrapping hypothesis testing in this case.
That's it Thank you!
Next post is
To read from the 1st post,