
UnsplashのKumiko SHIMIZUが撮影した写真
Hello. In this post, I will analyze Gender wage gap of OECD data with R.
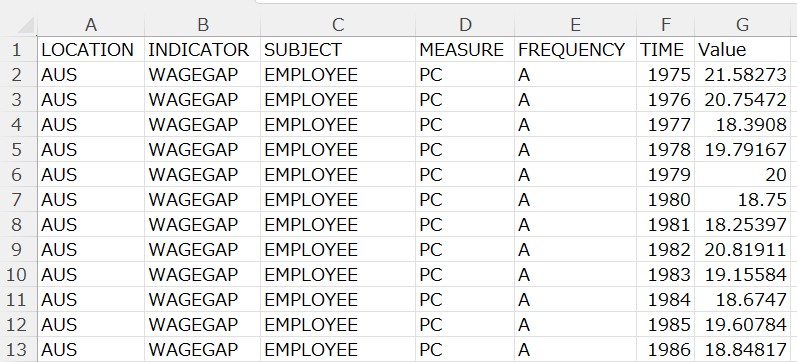
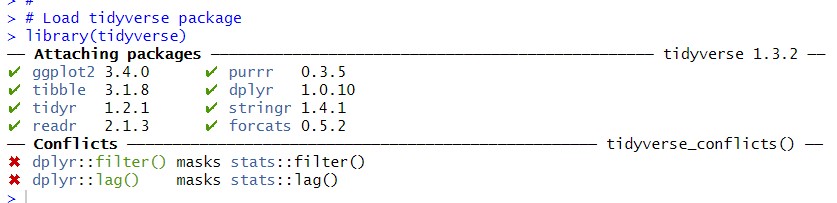
First, I download CSV file like belo from OECD web site,
https://data.oecd.org/earnwage/gender-wage-gap.htm
I use R to analyze this data.
I firstly load tidyverse package.
Then, use read_csv() command to load the CSV file data into R.
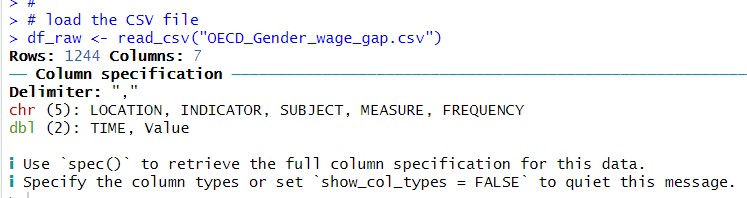
I see 5 variables are categorized as chr and 2 variables are categorized as dbl.
Let's check each variables.
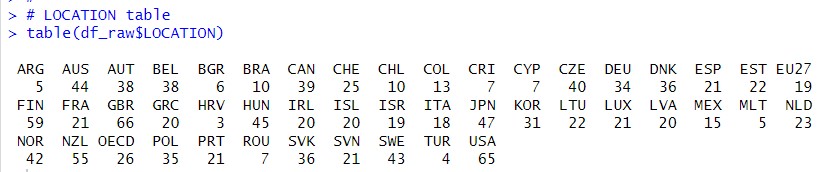
LOCATION is country.
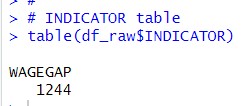
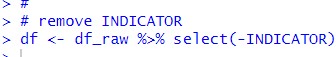
INDICATOR has only one value, WAGEGAP, so I will delete this variable.
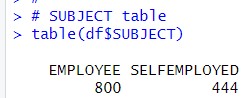
SUBJECT has two value, EMPLOYEE and SELFEMPLOYED. I keep SUBJECT.
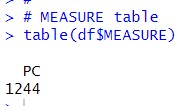
MEASURE has only one value, PC. I remove MEASURE.
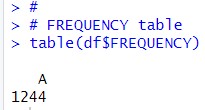
FREQUENCY has only one value, A, so I remove REQUENCY.
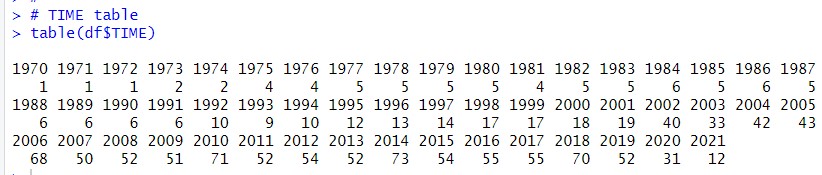
The oldest TIME is 1970 and the newest TIME is 2021. 2014 has the most many observations, there are 73 observations.
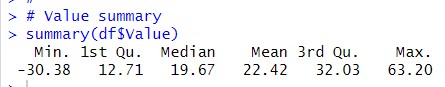
Let's calculate mean Value by SUBJECT.
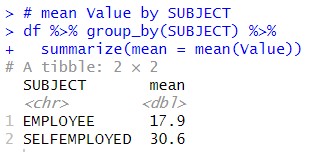
I see SELFEMPLOYED mean is higher than EMPLOYEE mean. It means there is much Gender gap in SELFEMPLOYED than in EMPLOYEE.
That's it. Thank you!
Next post is