
Unsplashのguy stevensが撮影した写真
This psot is following of above post.
In the previous post, I regress acc_nights, inter_arr and inter_dep on per_capita and trend term for Japan tourism flow data.
In this post, I will regress differenced acc_nights, inter_arr and inter_dep on differenced per_capita.
So, I make differenced variables.
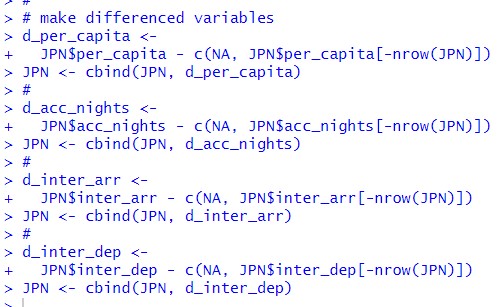
Abobe code is to work like below chart.
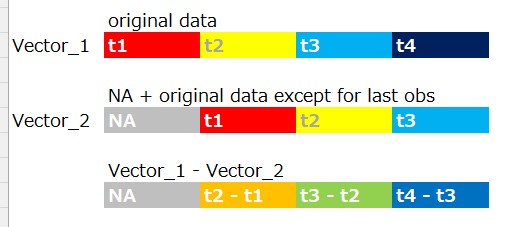
For exmple, Vector_1 is JPN$inter_dep and Vector_2 is c(NA, JPN$inter_dep[-nrow(JPN)]).
Then, let's do regression.
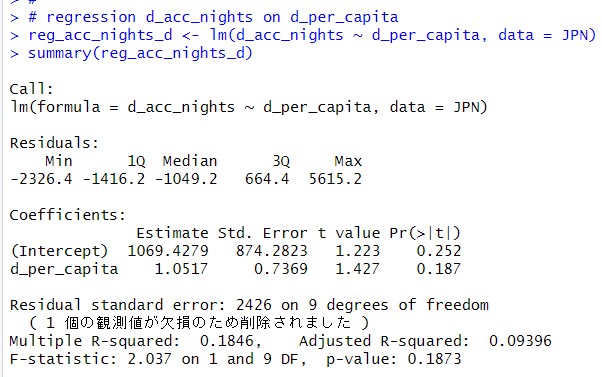
coefficients of d_per_capita is 1.0517, so 1 per_capita increase goes with 1.0517 acc_nights increase. But p-value is 0.187, it is greater than 0.05. So I cannot say p_capita increase is significant.
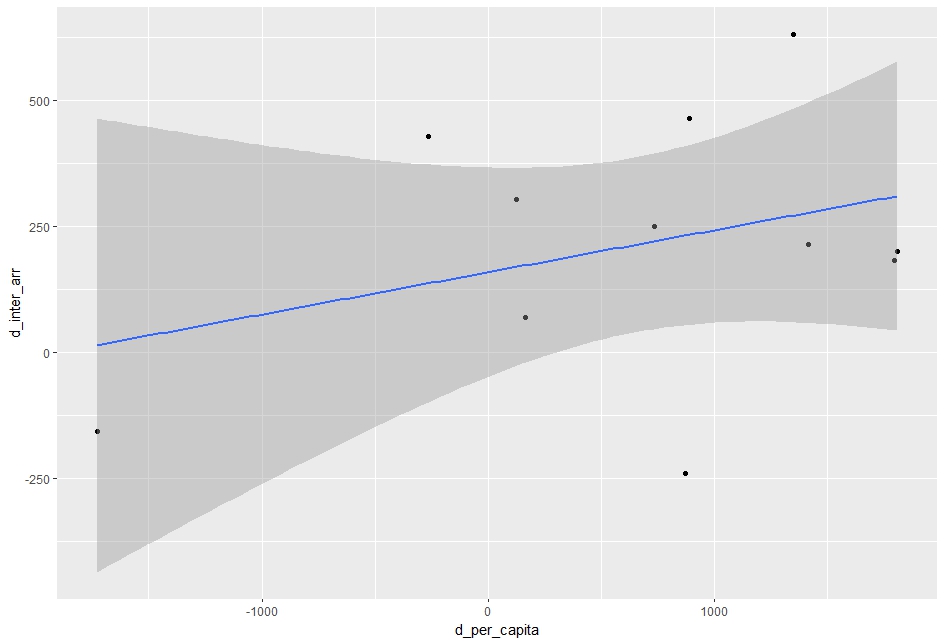
Next, regression d_inter_arr on d_per_capita.
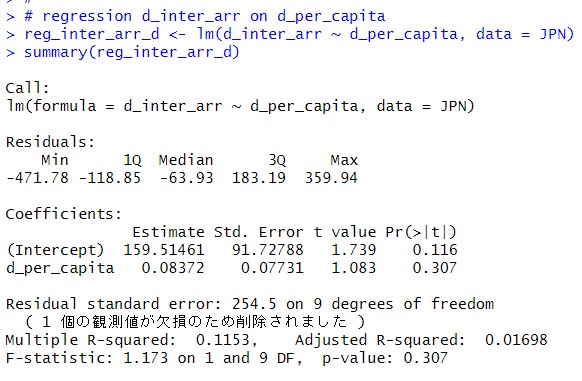
The coefficients of d_per_capita is 0.08372 and p-value is 0.307. So, d_per_capita is not practically and statistically significant.
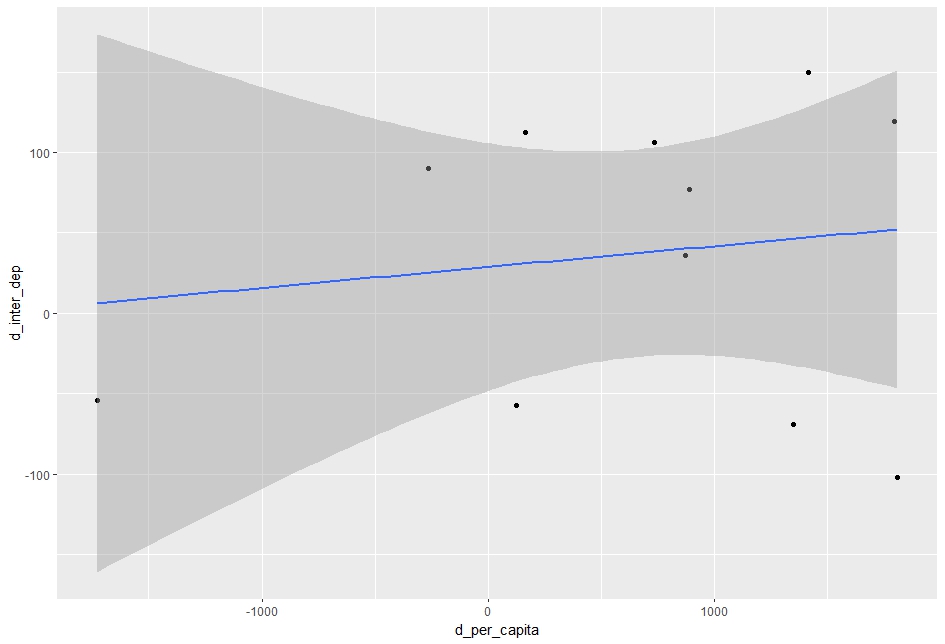
How about d_inter_dep ?
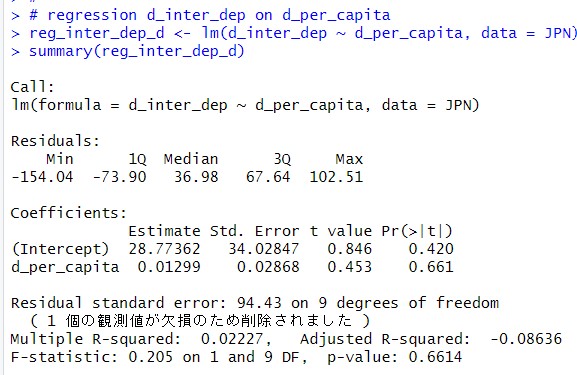
The coefficient of d_per_capita is 0.01299 and the p-value is 0.661. So, d_per_capita is not statistically and practically significant.
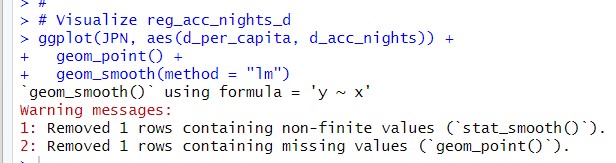
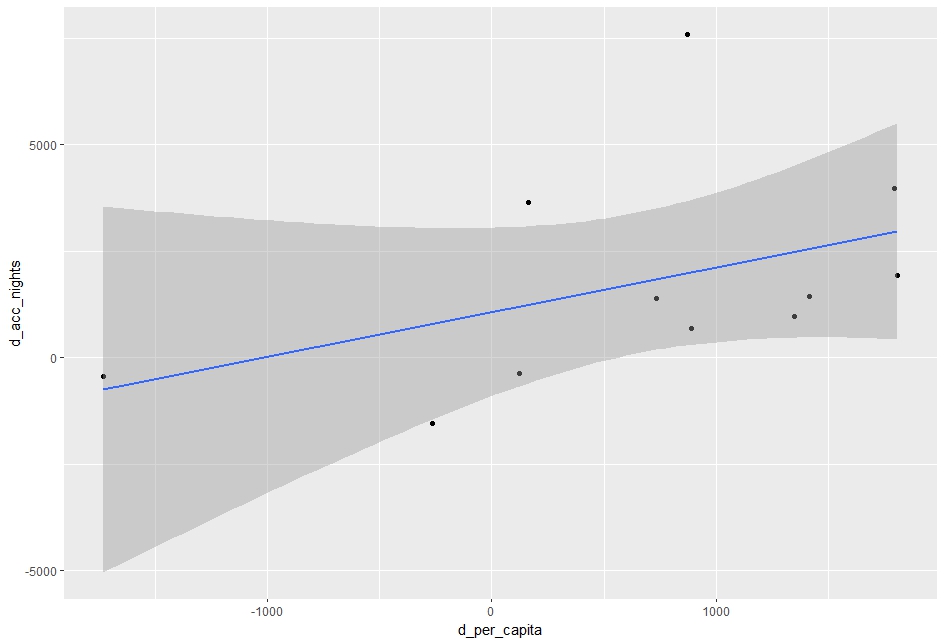
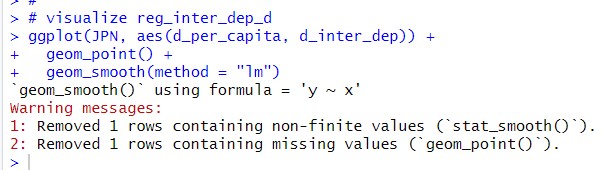
Let's visualize these three regressions. I can use geom_smooth() function.
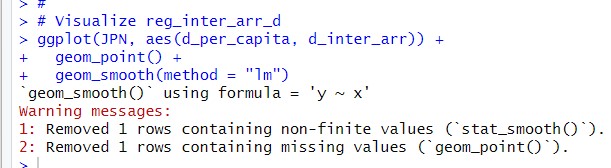
regression d_inrer_arr on d_per_capita graph.
Last, visualize regression d_inter_dep on d_per_capita.
That's it. Thank you!
Next Post is,
To read the 1st post,