
UnsplashのAditi Bhattが撮影した写真
www.crosshyou.info
This post is following of the above post. In the previous post, I make some scatter plots to feel some sense of variables relationships.
In this post, I will do corss sectional regression analysis.
First, I use TIME == 2021 data only.
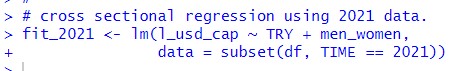
I use lm() function. To see the result, I use summary() function.
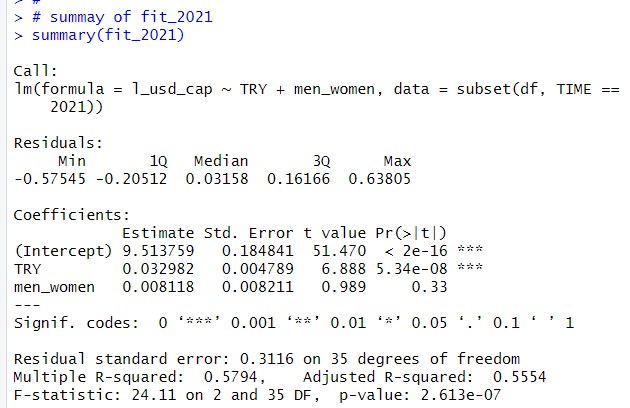
p-value shows 2.613e-07, so this model is valid. The Estimate of TRY is 0.032982 and Pr is 5.34e-08. So, TRY is statistically significant variable. men_women is not significant.
Another way to see the regression result is to use get_regression_table() function from moderndive package.
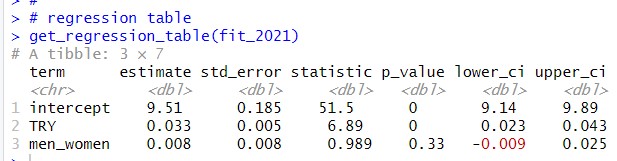
So, when men_women is fixed, 1 point increase TRY associates 0.033 inclease of l_usd_cap.
Let's see 2020 data.
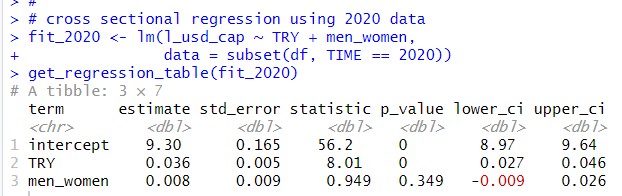
For 2020 data, the result is similar to 2021 result. The estimate is TRY is 0.036, it is a bit different. But confidence interval is 0.027 to 0.046 for 2020 data, 0.023 to 0.043 for 2021 data. The both confidence intervals are overraping.
For cross sectional regression analysis, it is important to check heteroskedasticity.
I use bptest() function from lmtest package.
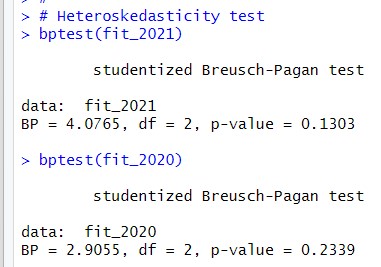
The both p-value is greater than 0.05, so I reject heteroskedasticity.
Then, I use all TIME data and add TIME dummies.
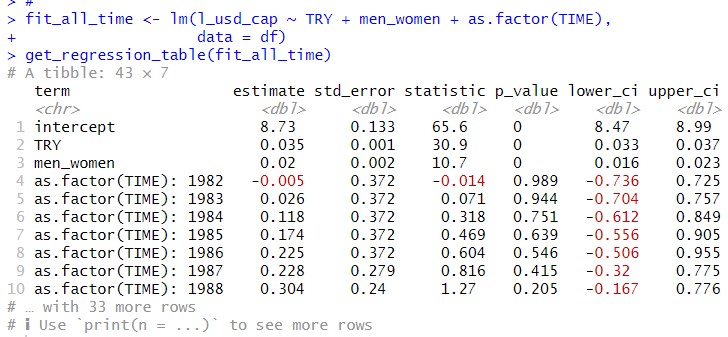
TRY estimate is 0.035 and p-value is 0. The estimate 0.035 is close to fit_2021 and fit_2020 results.
men_women estimate is 0.02 and p-value is 0. So, using all data, men_women is also statistically significant.
Let's check heteroskedasticity.
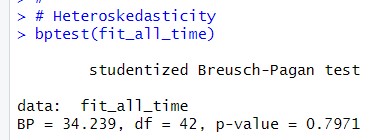
p-value is 0.791. So there is not heteroskedasticity.
That's it. Thank you!
Next post is
To read from the 1st post,