
UnsplashのJohannes Wが撮影した写真
This post is following of the above post.
In this post, I will do time series regression analysis.
Before starting this, let's see which LOCATION has the most obserbations.
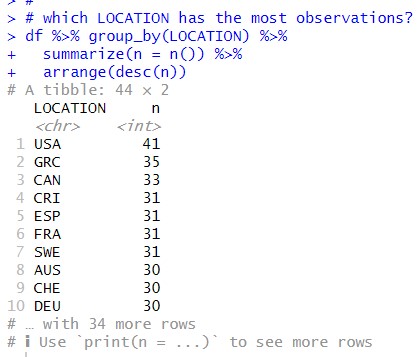
USA has 41 observations. So I will use USA for time series regression analysis.
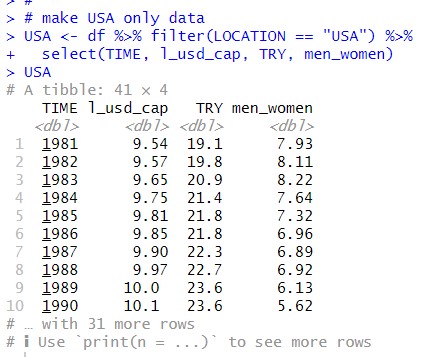
I make USA only data.
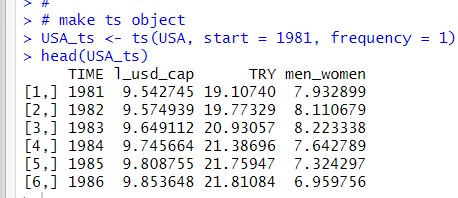
Then, I make ts object from USA data frame.
Let's use plot() function with USA_ts object.
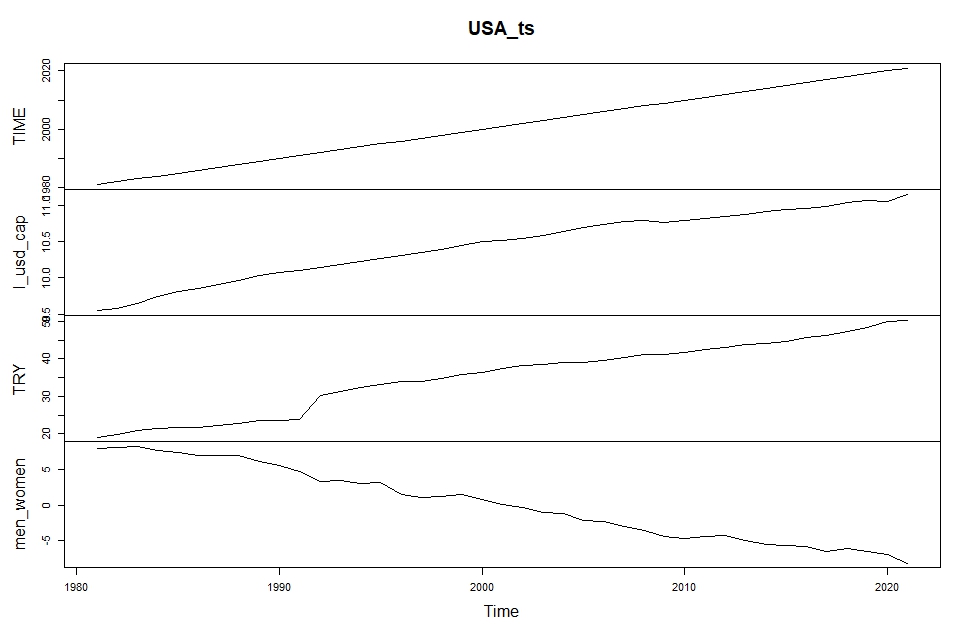
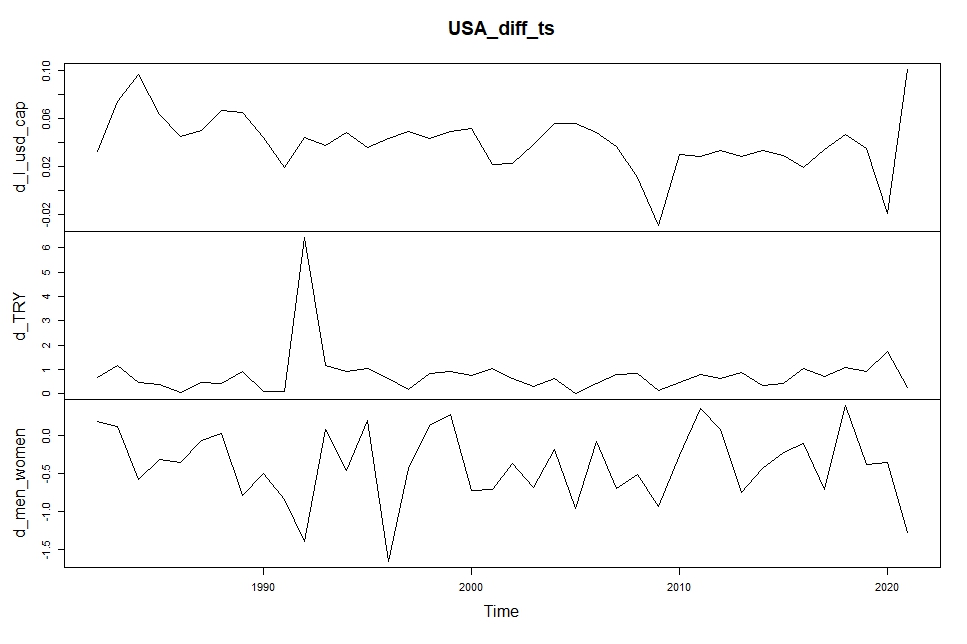
l_usd_cap, TRY and men_women have almost linear trends.
So, I think it is better to use differenced data, X(t) - X(t-1).
I use diff() function to make differenced variables.
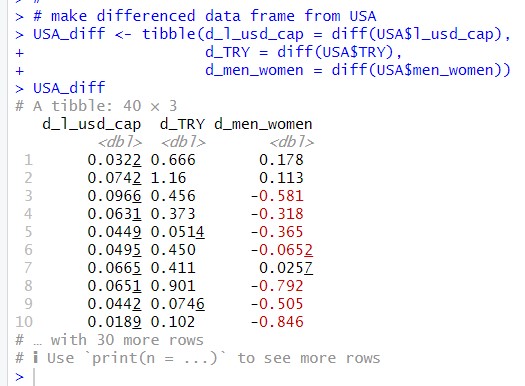
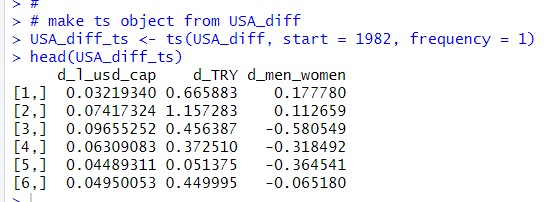
Then, I make ts object from USA_diff. This time, start year should be 1982.
Let's use plot() function to make a plot of USA_diff_ts.
Okay, let's make linear regression model.
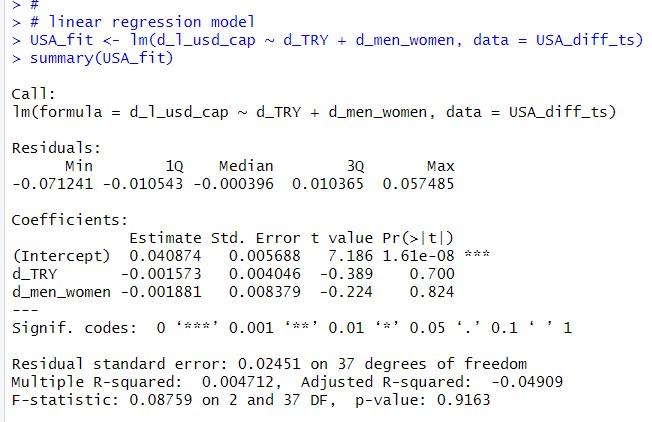
The model p-value is 0.9163. So d_TRY and d_men_women are not associated to d_l_usd_cap.
Maybe, lagged variables are associated. Let's check it. I use dynlm package.
I use d() expression in dynlm() function to add lagged variables.
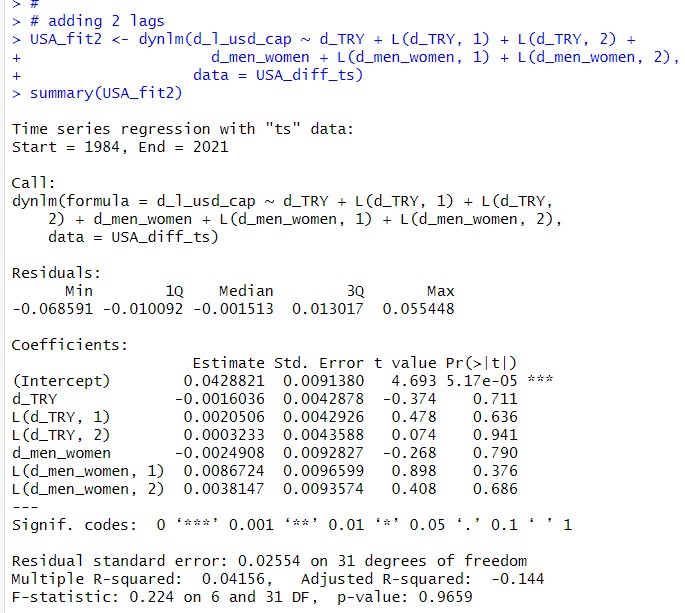
This model p-value is 0.9659, so this model is not valid.
I need to think of another model.
That's it. Thank you!
Next post is
To read from the first post,