
Photo by Ashutosh Saraswat on Unsplash
This post is following of aabove post.
In this post, I will do some time-series regression with R.
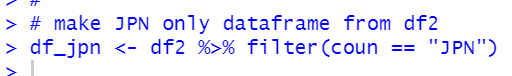
First, I made JPN only dataframe.
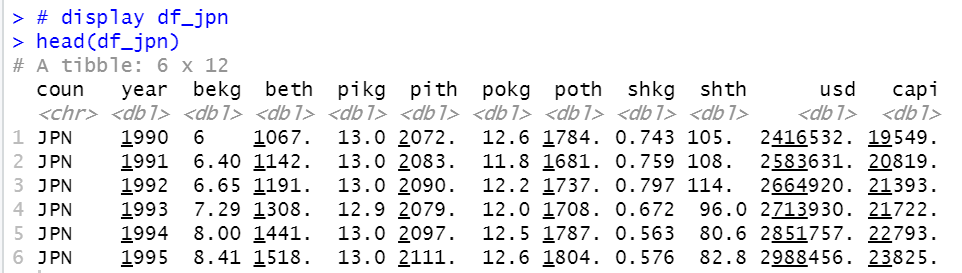
Let's see df_jpn.
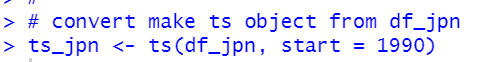
Then, I make ts object form df_jpn.
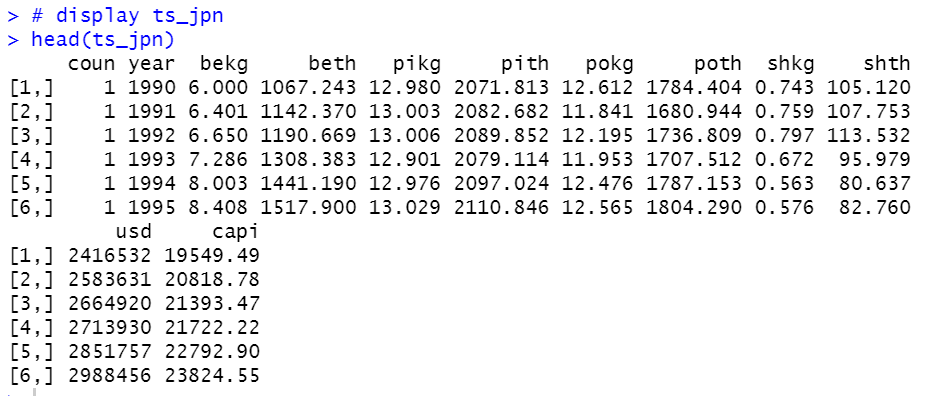
Let's see pokg and capi.
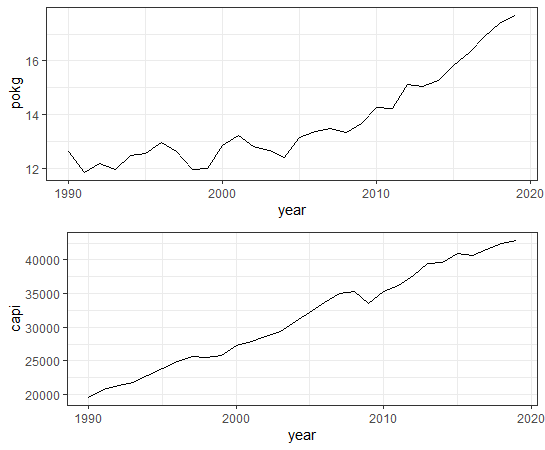
The both, pokg: POULTRY KG_CAP and capi: per capita GDP have uptrend.
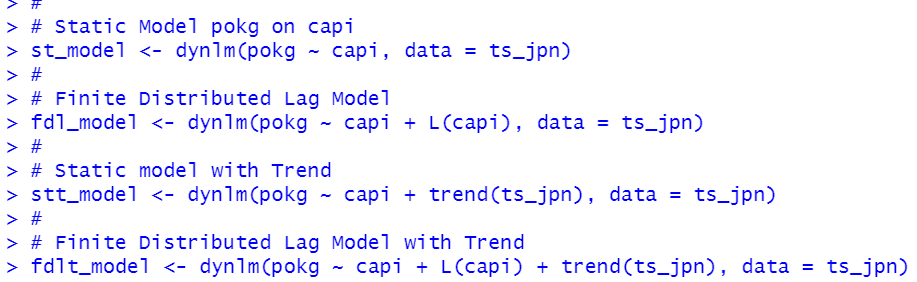
I will make 4 time-series regression models.
1. Static Model
2. Finite Distributed Lag Model
3. Static Model with Trend
4. Finite Distrubuted Lag Model with Trend.
Before make regression models, I load dynlm package.
All right, let's make those models.
I use stargazer package to make results table.
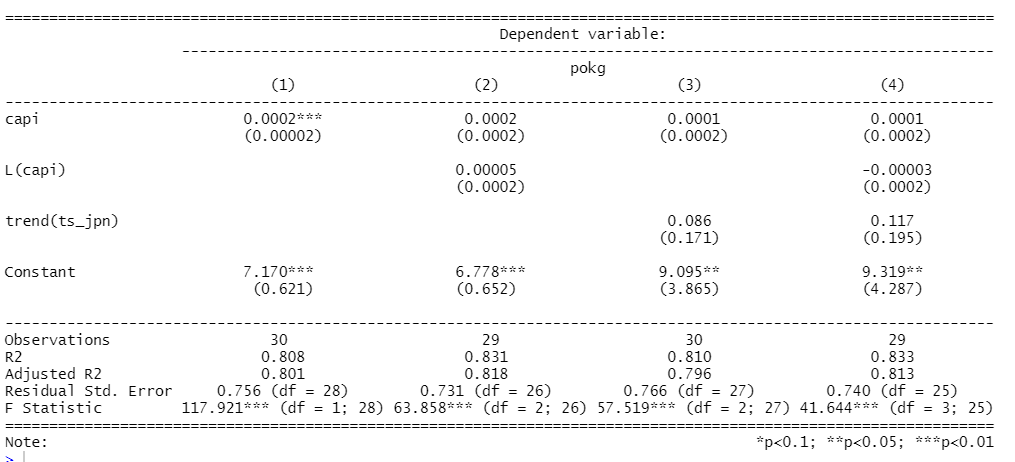
We see capi has positive coefficients.
That's it. Thank you!
Next post is
To read the 1st post,