
UnsplashのNastasia Kalininaが撮影した写真
This post is following of the above post.
Let's see summary statistics.
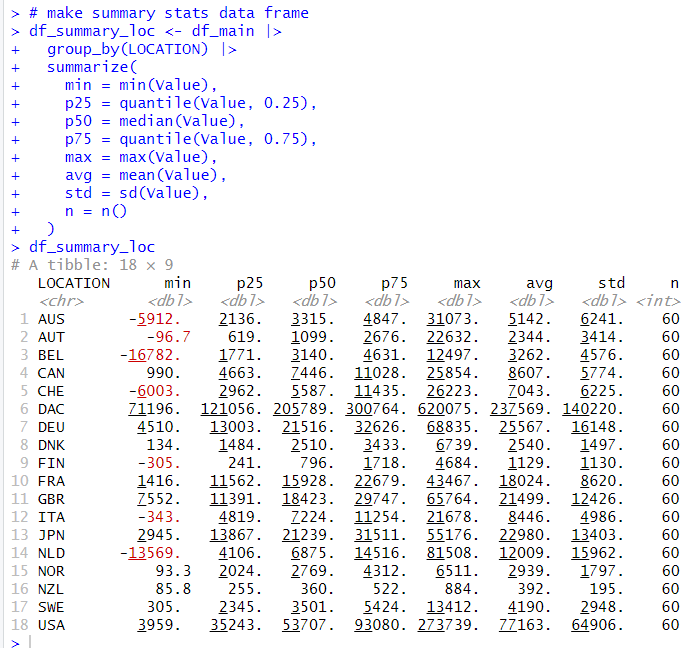
First, let's see summary statistics by LOCATION.
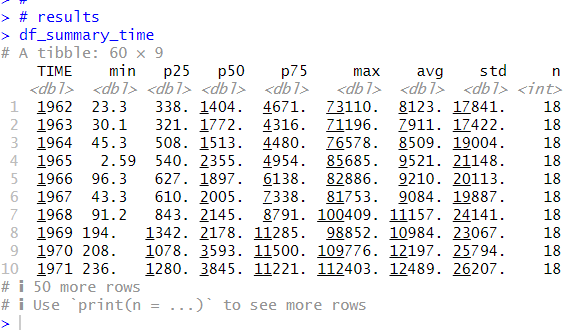
Let's see summary stats by TIME.
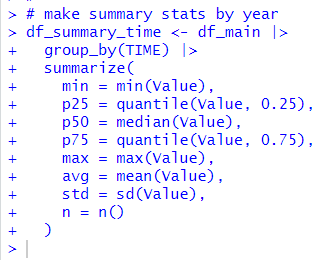
I use group_by() function, then I use summarize() function and min(), quantile(), median(), max(), mean(), sd() and n() function.
Let's see the result.
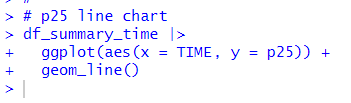
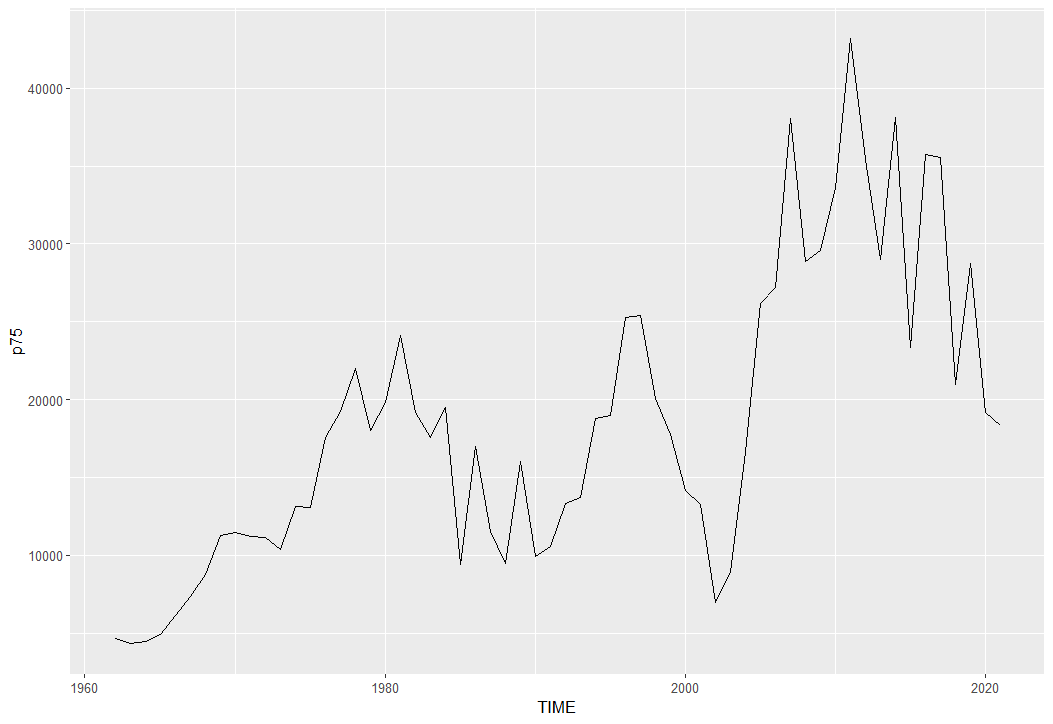
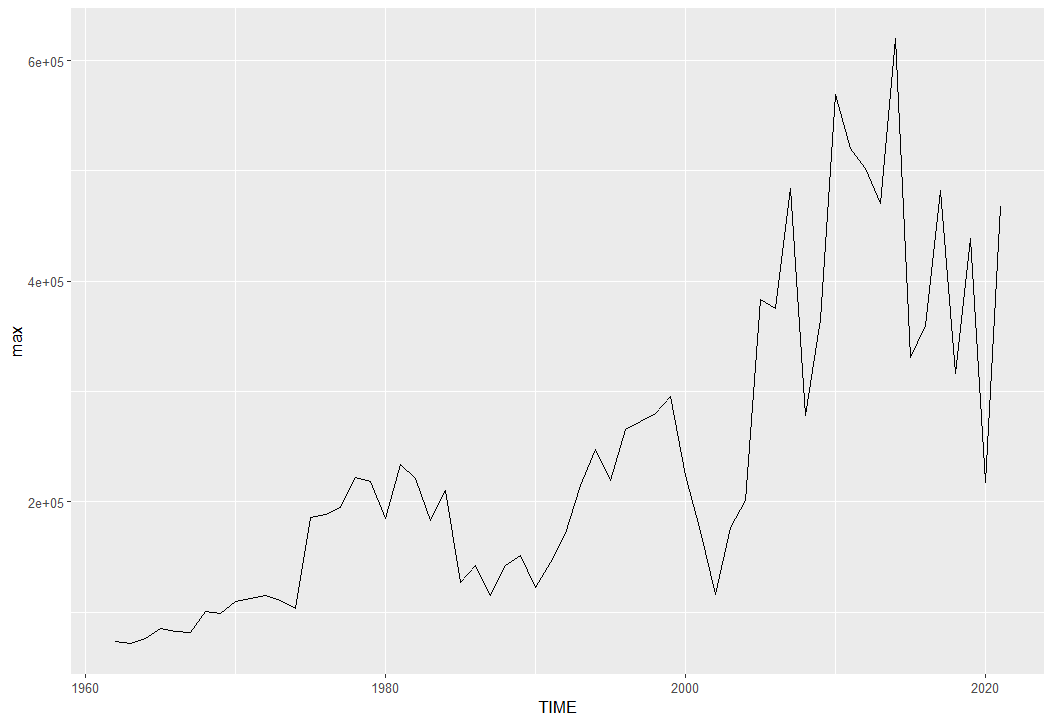
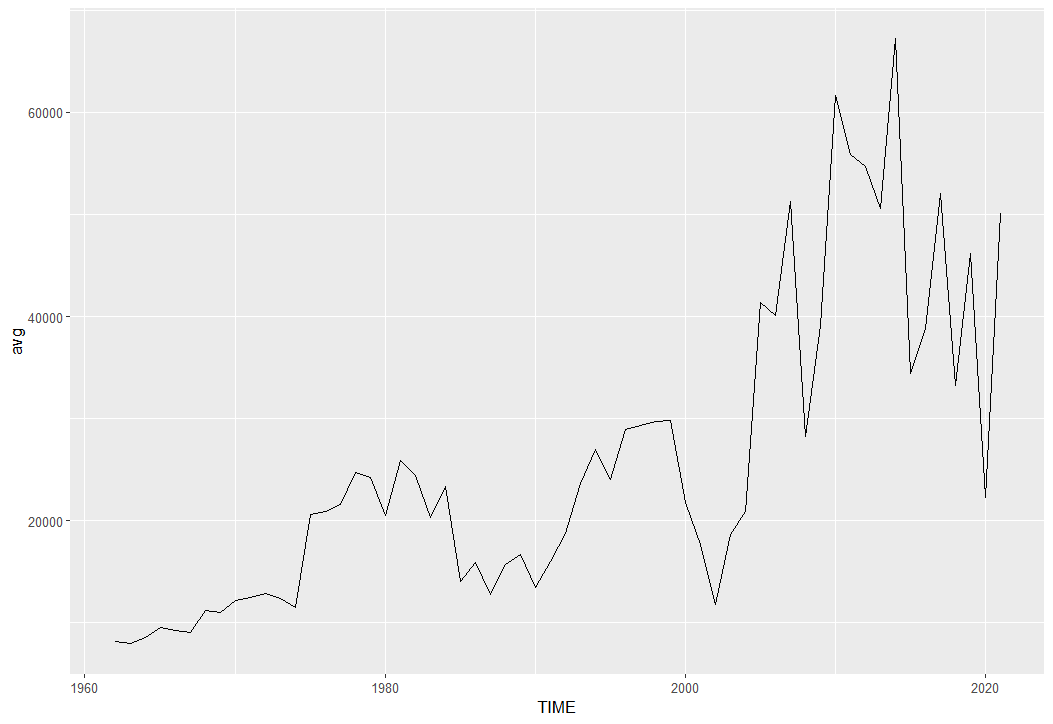
Let's see each stats with line chart.
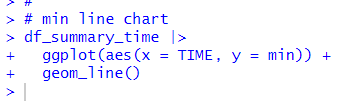
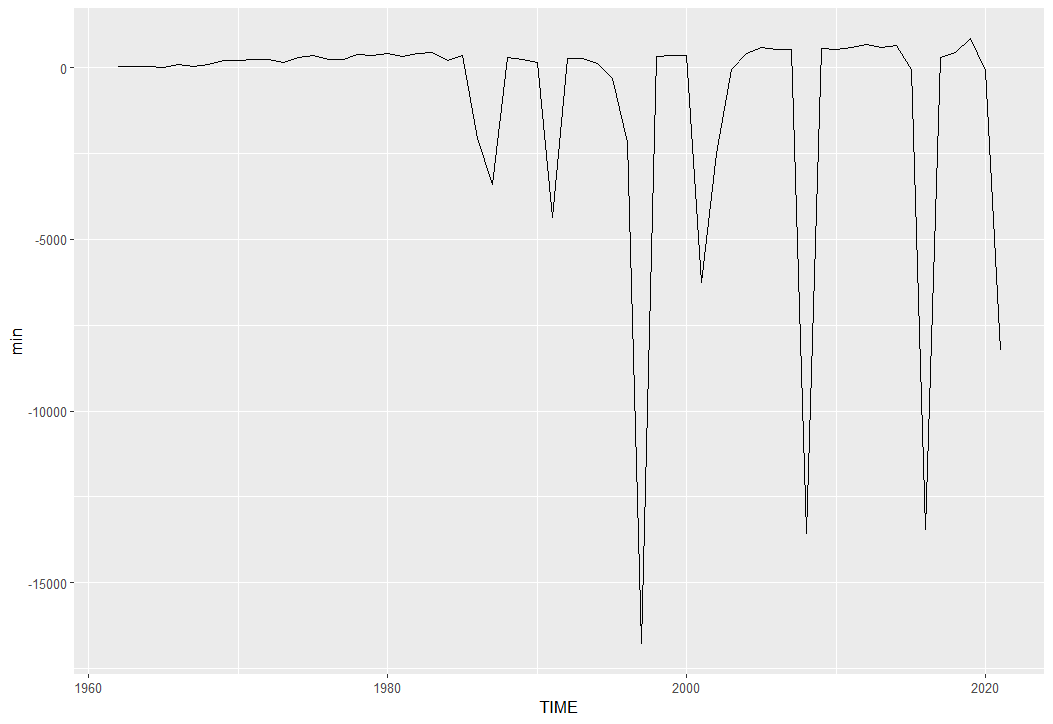
For minimum value, there are some extraordinaly nagative values.
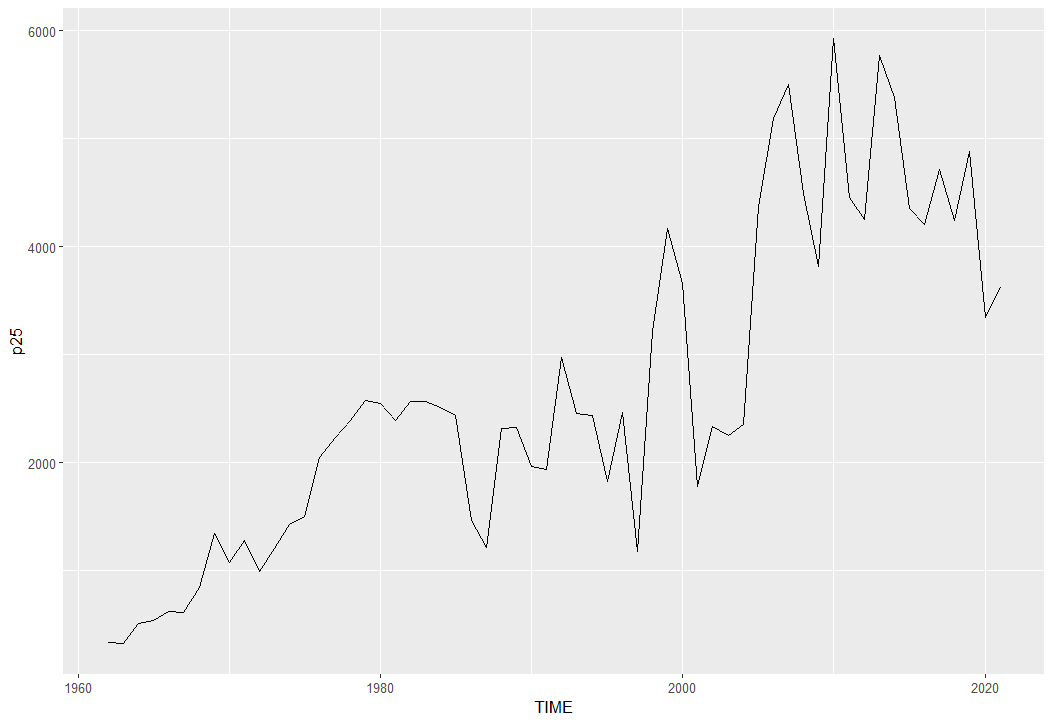
For p25 (25 percentile), it is up trend.
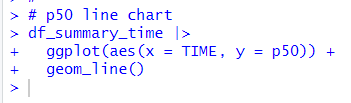
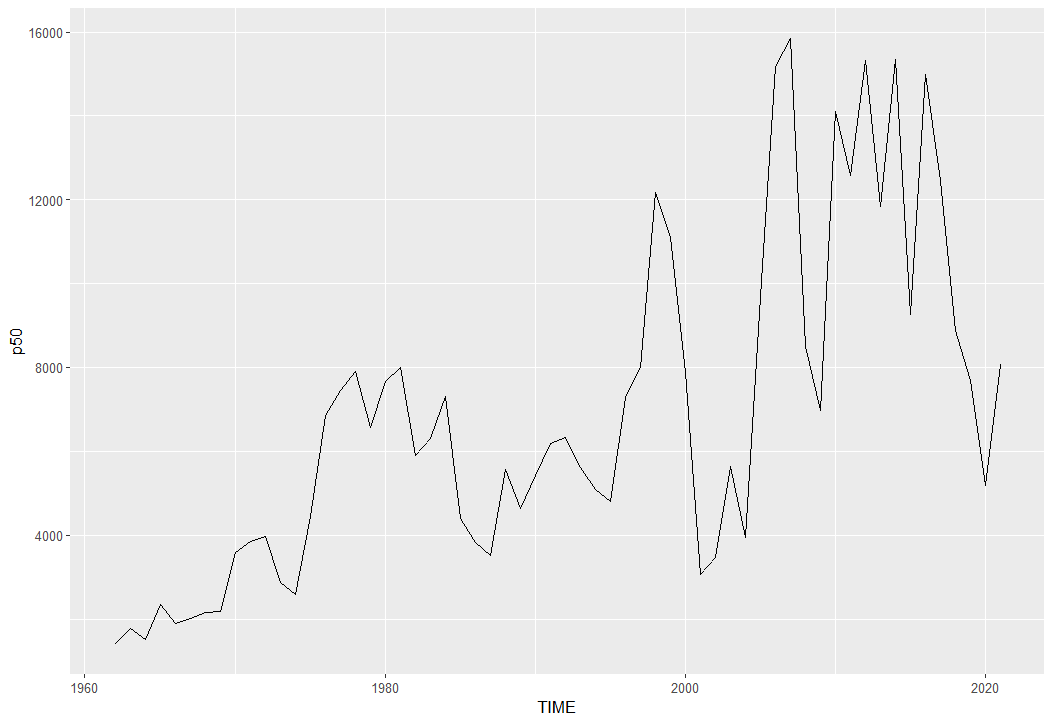
For p50, it is similar to p25.
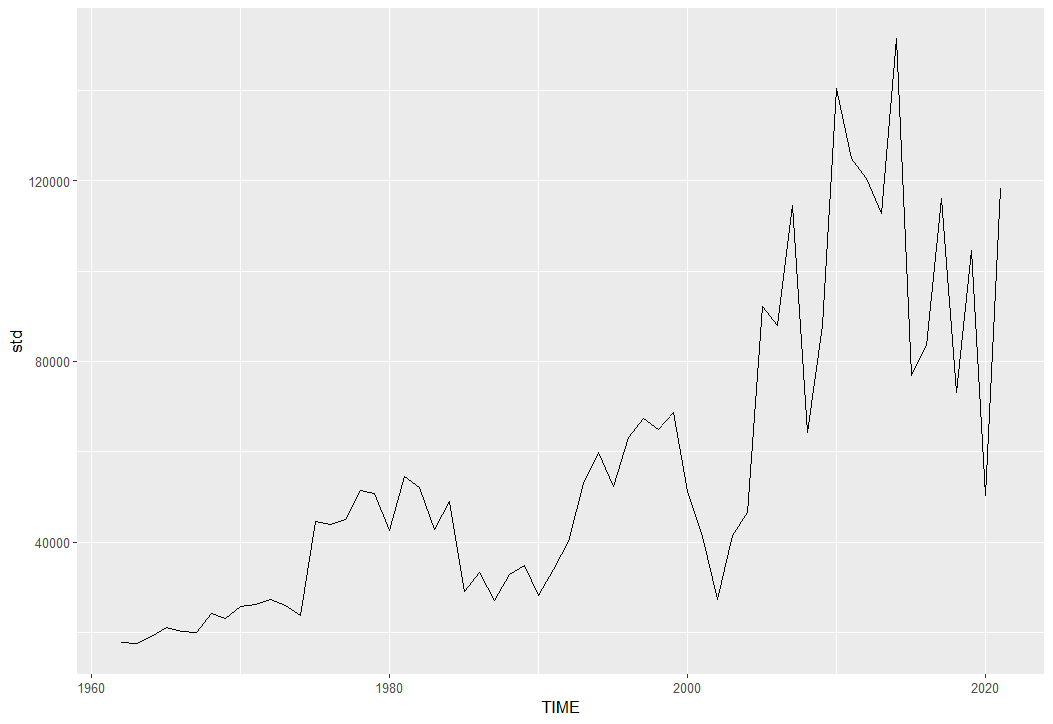
I found minimum value has different trend than other stats. So, it is good idea to analyze from minimum value point of view.
let's see df_summaly_loc again.
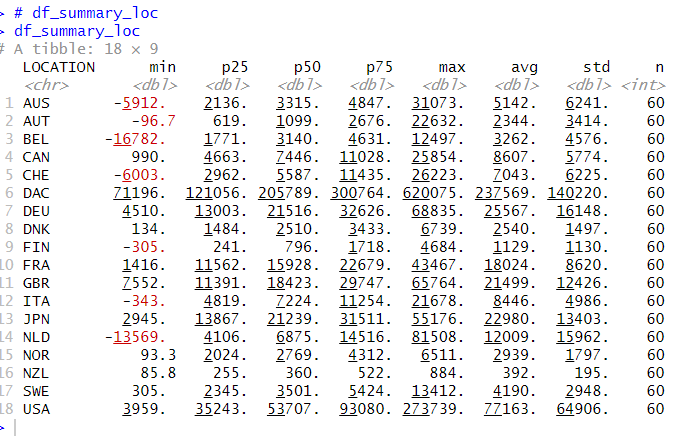
Some LOCATION has negative min value and some don't.
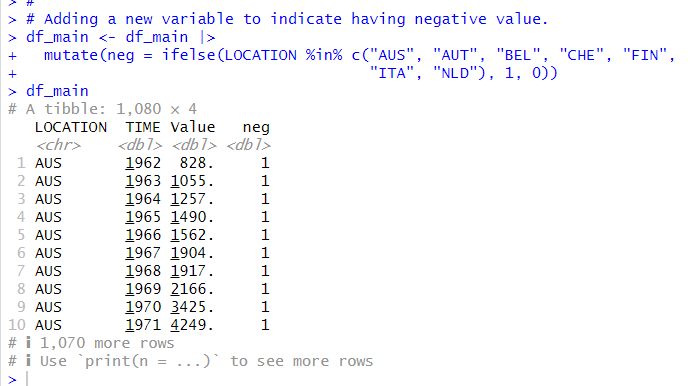
AUS, AUT, BEL, CHE, FIN, ITA and NLD have negative min.
I added a new variable to indicate having negative Value.
That's it. Thank you!
Next post is,
To read from the 1st post,