
Generated by Bing Image Creator: Pictures of plum blossoms blooming in a rainforest.
This posit is following of the above post.
In the previous post, I make two groups for LOCATION, one is neg == 1, which has negative value of Value, the other is neg == 0, which does not have negative value of Value.
Let's see the difference of those two groups.
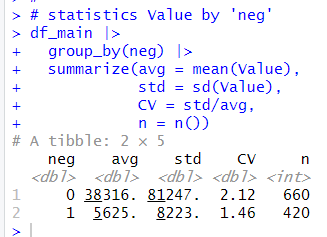
neg == 1 group are small group from the Value point of view.
For CV, neg == 1 have more variability.
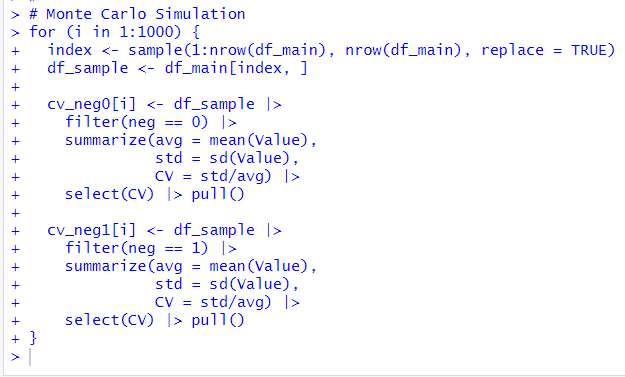
Let's check wheter CV are statistically different.
Since there is no formula to check CV difference, I use Monte Carlo Simulation.
I start with making objects to store CVs.

Then, I set random seed.

Let's do Monte Carlo Simulation
Let's see histograms of cv_neg0 and cv_neg1.

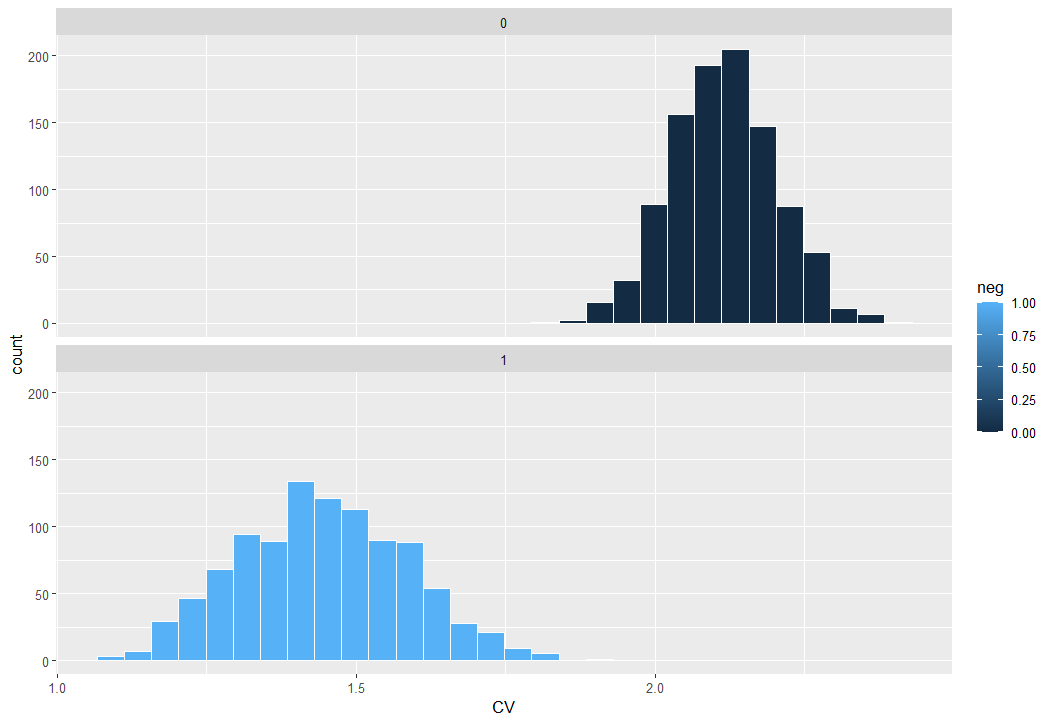
Upper histogram is neg == 0, Lower histogramis neg == 1.
I see the both are clearly different.
Let's calculate 0.025 and 0.975 quantile values.
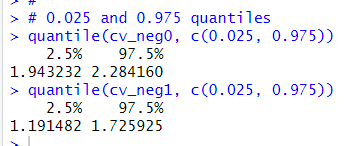
2.5 percentile for cv_neg0 is 1.94 and 97.5 percentile for cv_neg1 is 1.726.
So, the both 95% confidence interval does not wrap each other.
So, the both CVs are statistically different.
Let's double check it using t.test().
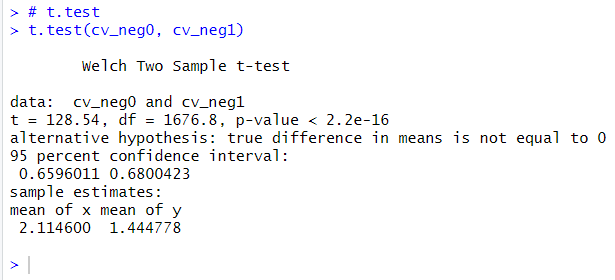
p-value is less than 2.2e-16. It shows the same conclustion with percentile method confidence inerval.
That's it. Thank you!
The next post is
To read form the 1st post,