This blog is following of
In this blofg, I will make barplot with error bars.
1. check n(number of overbations) of each SUBJECT
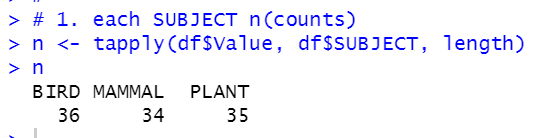
We see BIRD has 36, MAMAL has 34 and PLANT has 35 observations.
2. calculate average pf each SUBJECT
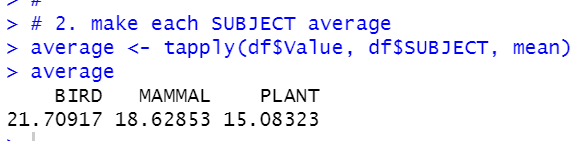
We see BIRD has the highest average. Plant has the lowest average.
3. caclulate variance of each SUBJECT
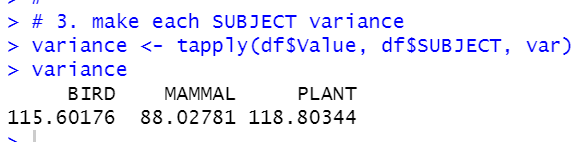
We see PLANT has the largest variance and MAMMAL has the smallest variance.
4. calculate S.E., standard error. Formula is sqrt(variance/n)
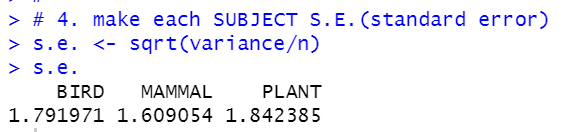
We see PLANT has the largest S.E. and MAMMAL has the smallest S.E.
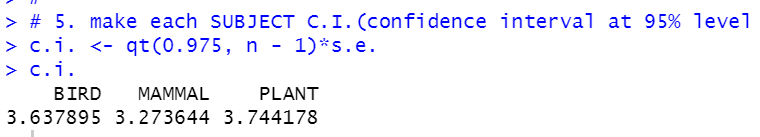
5. calculate C.I., confidence interval. Formula is t(alpha, d.f.)*S.E. We calculate 95% level C.I.
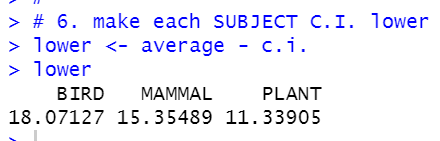
6. calculate lower level of C.I. Formula is average - C.I.
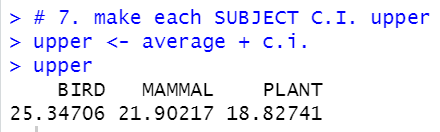
7. calculate upper level of C.I.. Formula is average + C.I.
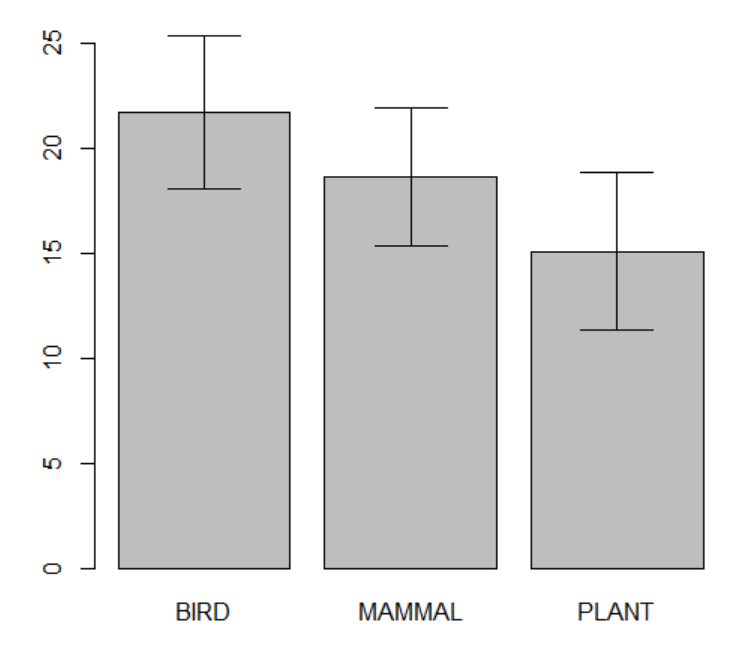
All right, we get all values to make a bar plot with error bar.
We will use barplot() and arrows().

NIce!. Let's make a table for above data.

That't is. Thank you for reading.
Next blog is
To read the first blog,