Hello. In this blog, I will analyize OECD Threatend species data.
First, I goet data from OECD web site.
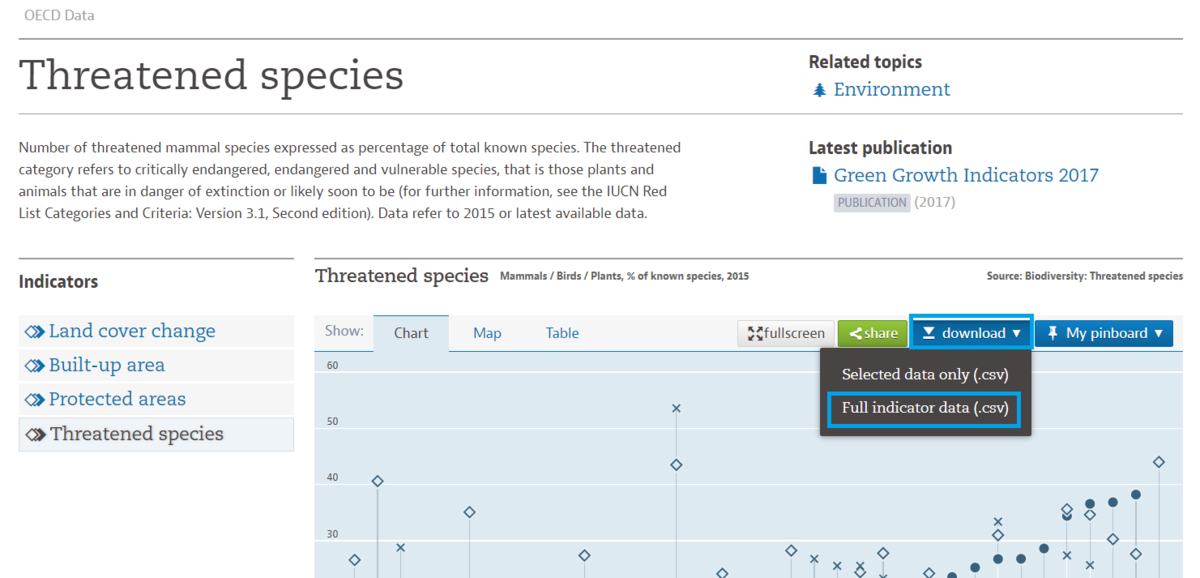
Biodiversity - Threatened species - OECD Data
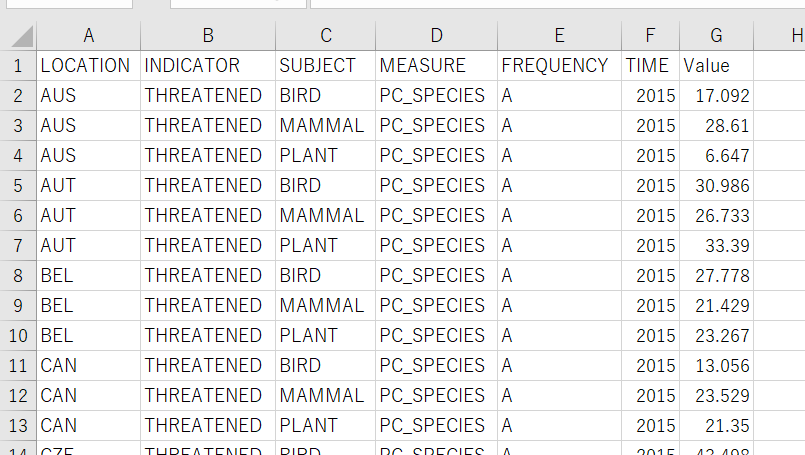
The csv file looks below
Let's read this file into R.
First of all, load tidyverse pachage.

Then, use read_csv() function to read a csv file.
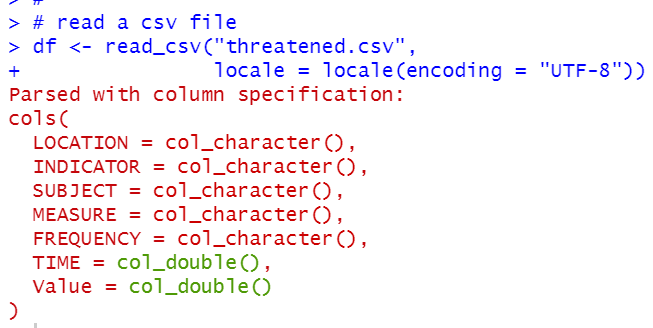
let's check if we load the file sucsessfully with str() function.

It seems we successfully load the csv file data.
The, check how may values are threre in each variables. I use table() function.
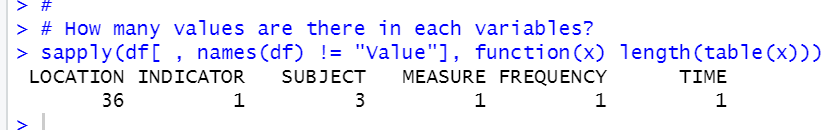
So, there are 36 locations and 3 subjects. Others are only one value.
INDICATOR is THREATENED, MEASURE is PC_SPECIES, FREQUENCY is A and TIME is 2015.
So, this data is as of 2015 data set.
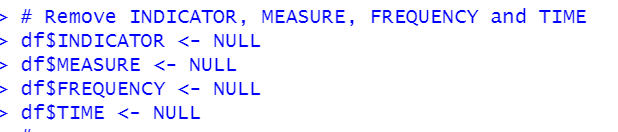
Let's remove INDICATOR, MEASURE, FREQUENCY and TIME.
I made SUBJECT to factor class.

Then, use summary to see data frame summary.
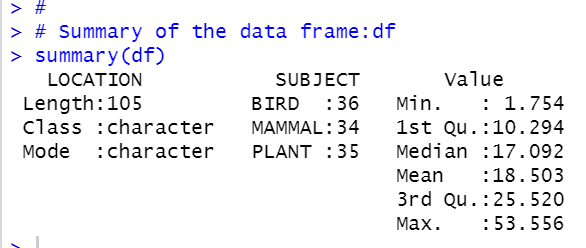
Value is number of threatened species expressed as percentage of total known species. So the highest dangerous location has 53.556% and lthe owest locations has 1.754%.
That's it.
For the next blog