UnsplashのErik Knoefが撮影した写真
In this post, I will analyze OECD Tourism flows data analysis.
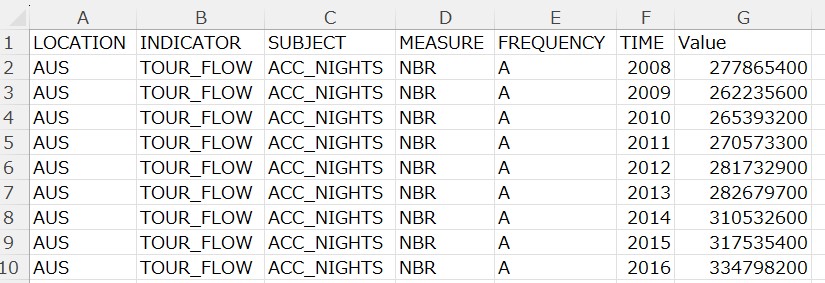
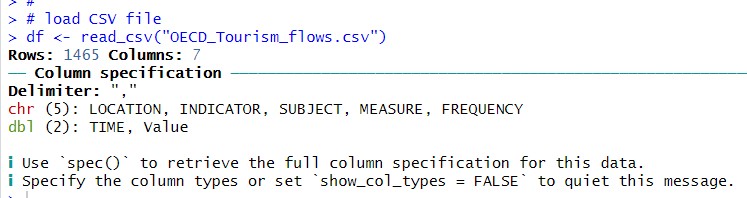
I download CSV file from the OECD website.
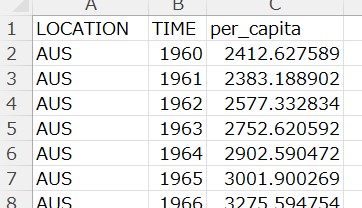
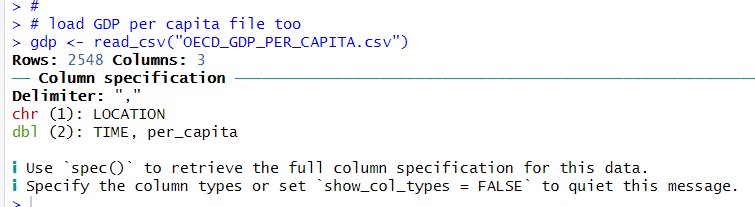
I also downladed GDP per capita data from OECD web site.
I use R for data analysis.
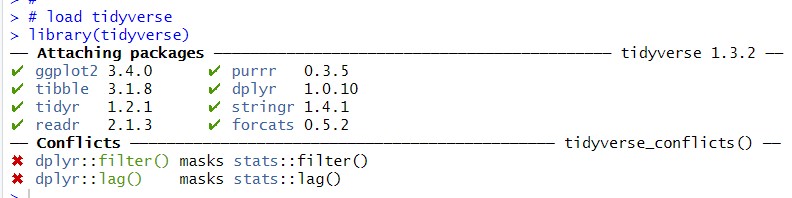
First, I load tidyverse package.
I use read_csv() fundtion to load CSV file data into R.
I also load GDP per capita CSV file.
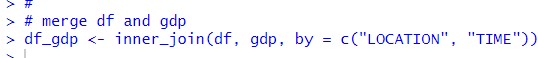
Then, I merge 'df' and 'gdp' with inner_join() function and make a new data frame.
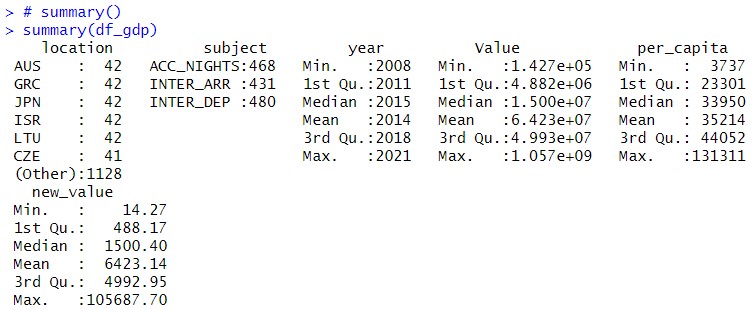
Let's use summary() function to get 'df_gdp' summary statistics.
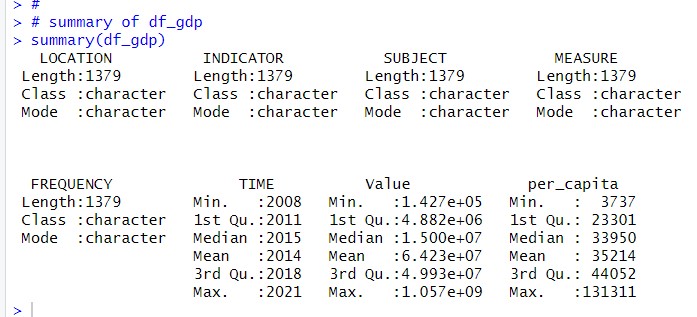
From 'LOCATION' to 'FREQUENCY', there is not so much information, I just know there are 1379 observations.
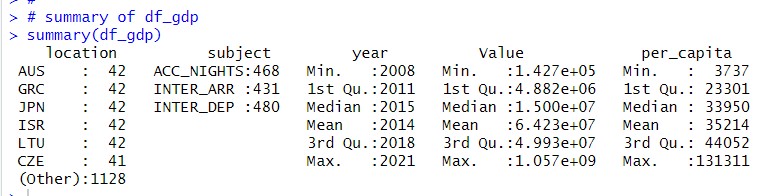
For TIME, I know it strats from 2008 to 2921.
Value comes from 'df' and 'per_capita' comes from 'gdp'.
Let's check LOCATION with table() function.
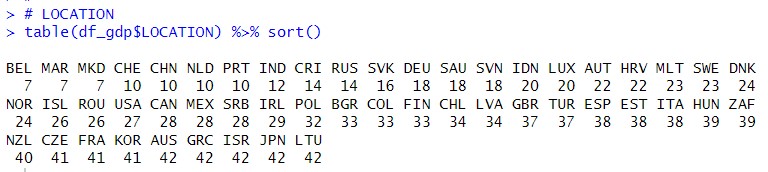
LOCATIONs which have most observations are AUS, GRC, ISR, JPN and LTU.
Let's see INDICATOR
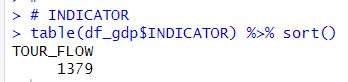
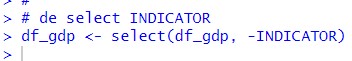
INDICATOR has only one value, TOUR_FLOW, so I can remove this variable.
Let's check SUBJECT
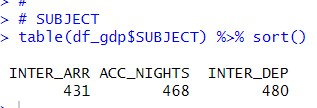
INTER_ARR is arrival number of tourist, ACC_NIGHTS is accomodation nights and INTER_DEP is departure number of tourist. I keep SUBJECT.
Let's check MEASURE.
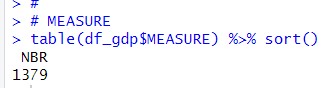
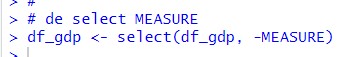
MEASURE has only one value, NBR. so I remove MEASURE from df_gdp.
Let's check FRQUENCY
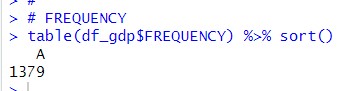
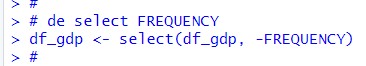
FREQUENCY has only one value, A. So I can remove FREQUENCY.
Then, I mutate LOCATION and SUBJECT to factor class.
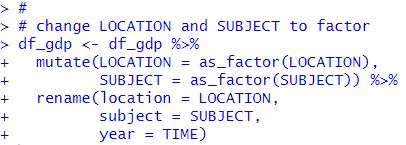
I also changed variavle names.
All right, let's use summary() function again.
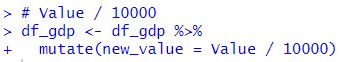
I think Value can be re-scale. I divide Value by 10000.
Let's see summary.
That's it for this post. I will continure analysis in the next post. Thank you!
Next post is