
This post is following of the above post.
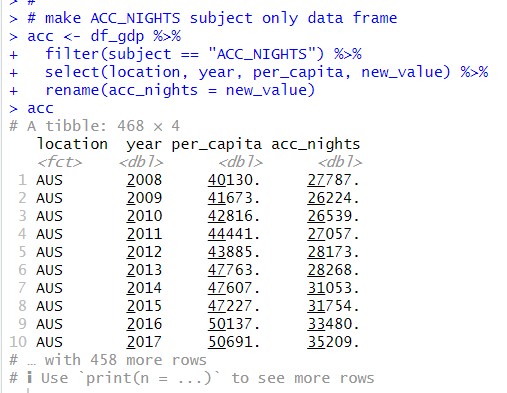
I make ACC_NIGHTS only data frame with filter() function in R.
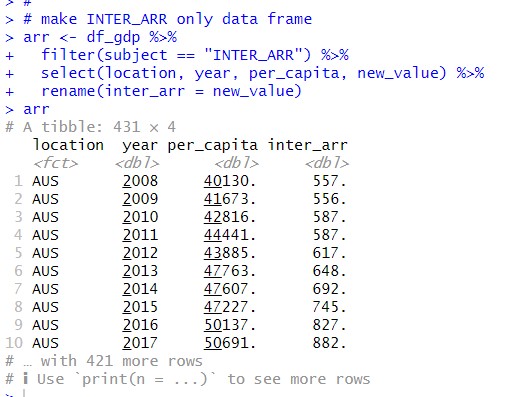
Next, I make INTER_ARR only data frame.
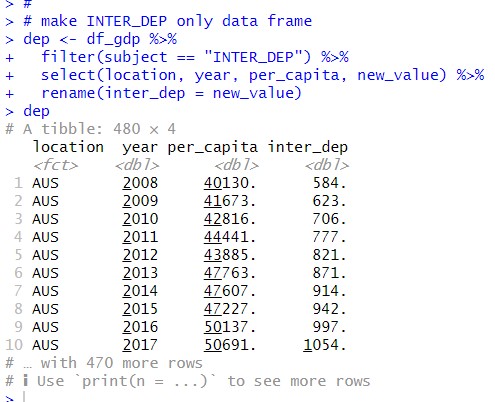
I make INTER_DEP only data frame.
Then, I merge those three data frames into one data frame using inner_join() function.
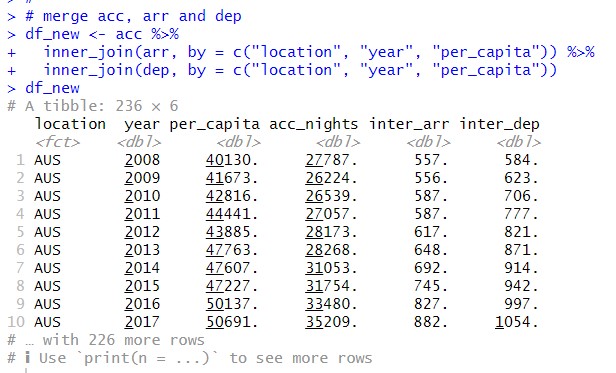
I will analyze df_new data frame.
Let's see summary statistics with summary() function.
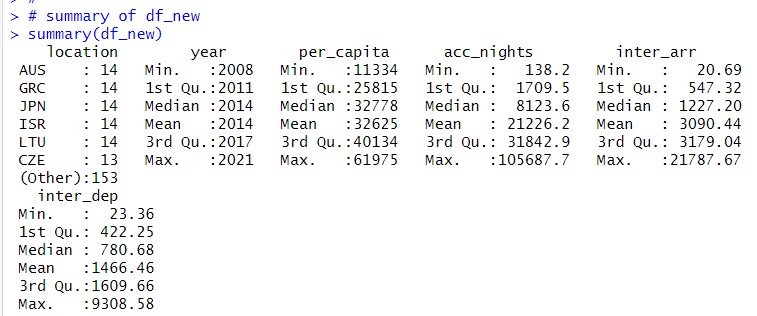
I see AUS, GRC, JPN, ISR and LTU have 14 observations. Year starts from 2008 to 2021.
per_capita varies from 11224 to 61975, mean is 32625.
acc_nights varies from 138.2 to 10568.7, mean is 21226.2.
inter_arr varies from 20.69 to 21787.67, mean is 2090.44.
inter_dep varies from 23.36 to 9308.58, mean is 1466.46.
Let's visualize each variables.
I start with location.
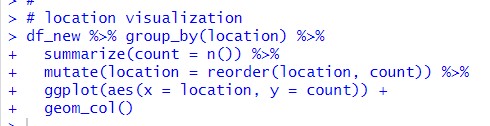
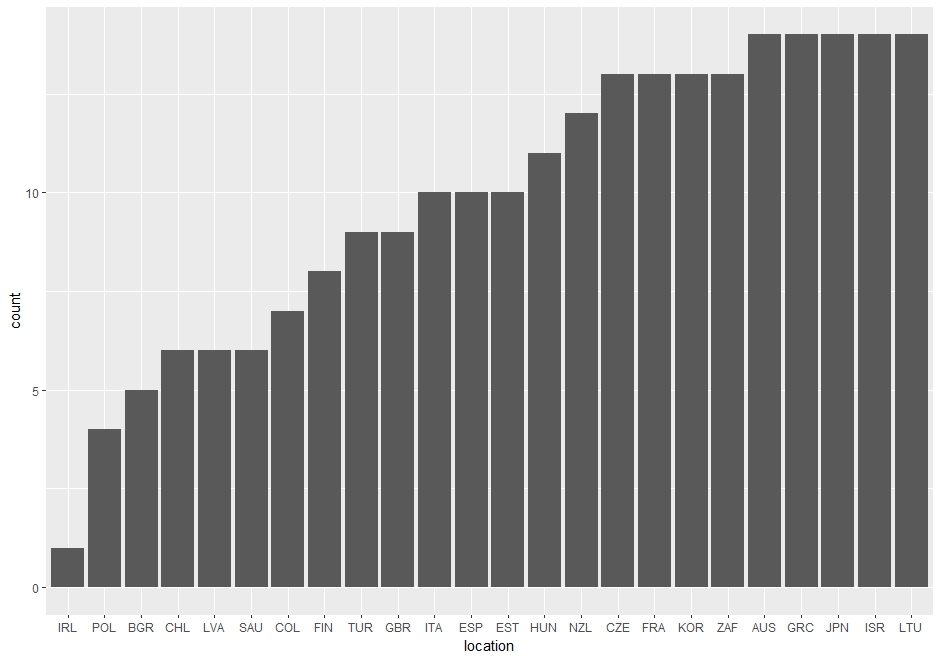
Since location is a categorical variable, I use group_by() and summarize() function to count number of observations of locations, then I use geom_col().
Next, year.

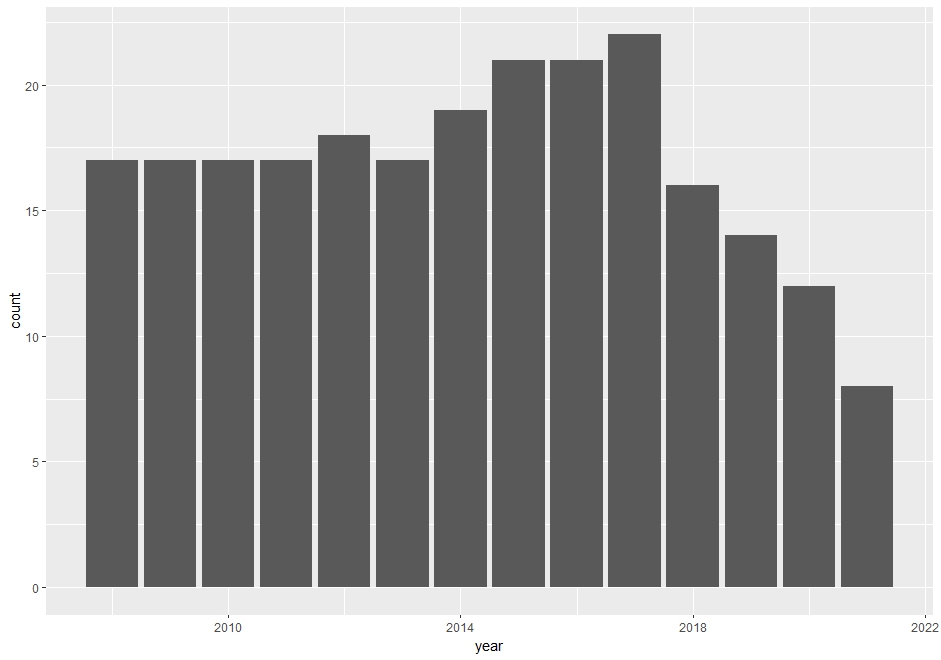
I use geom_bar() function to count number of observations of year, I see 2017 has the most observations.
Let's go on with per_capita

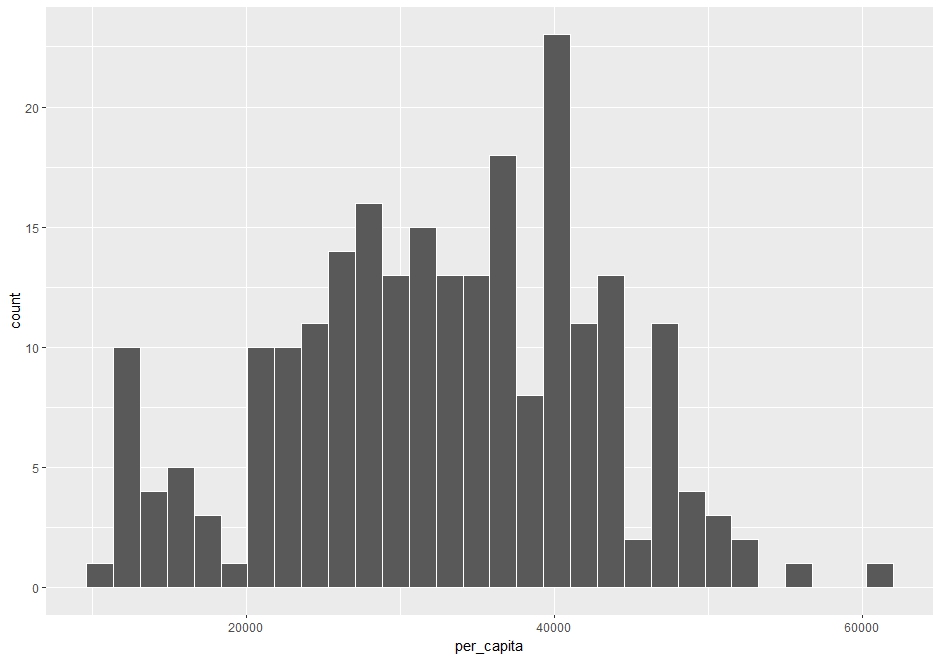
Since per_capita is a numerical variable, I use geom_histogram() function for drawing a histogram.
Next, acc_nights.

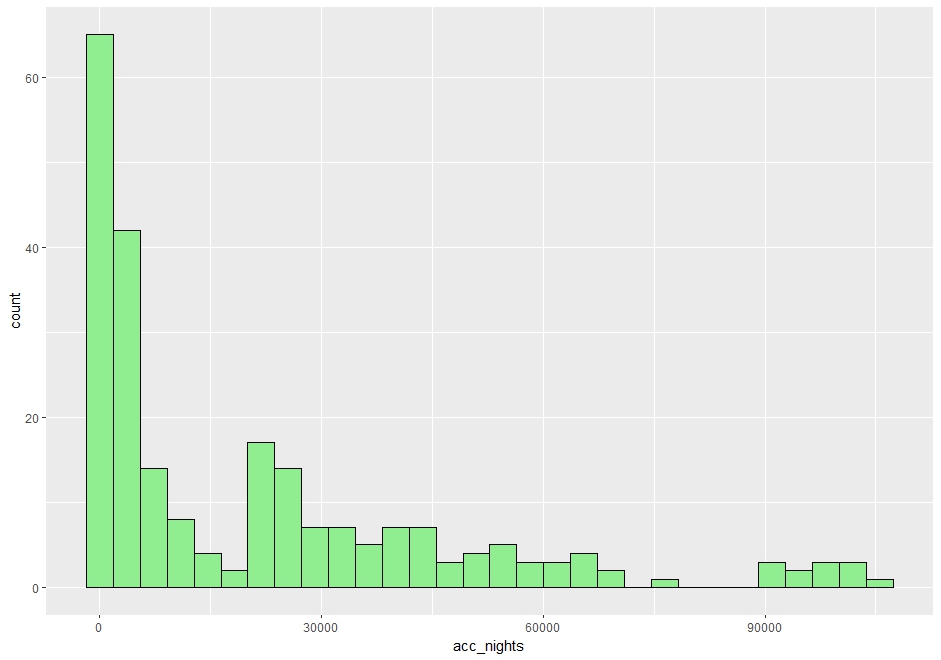
I see acc_nights are not normaly distributed. it is very skewed to the right direction.
How about inter_arr?

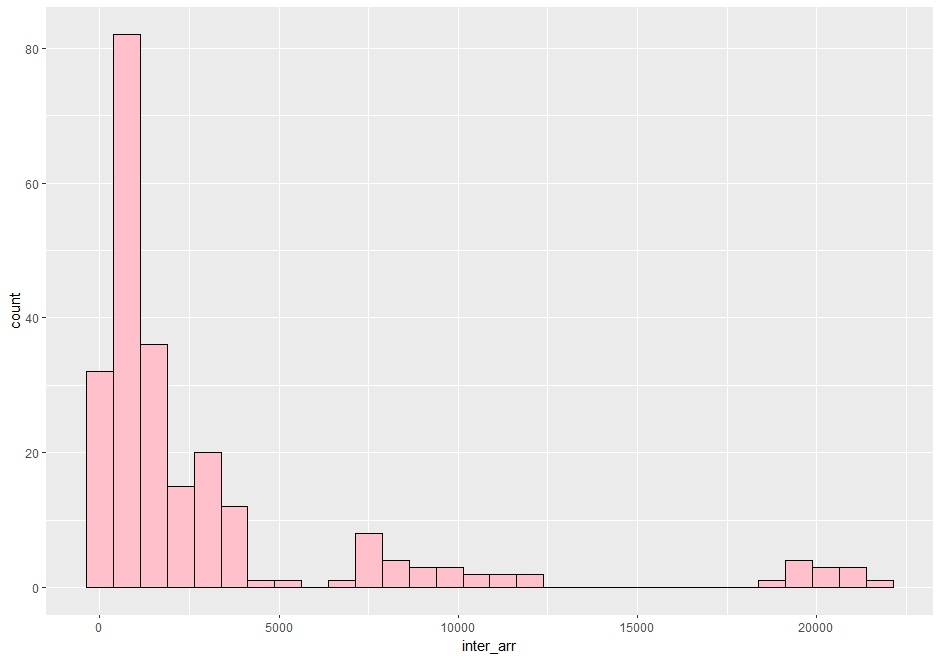
inter_arr are also skewd.
Last, let's check inter_dep.

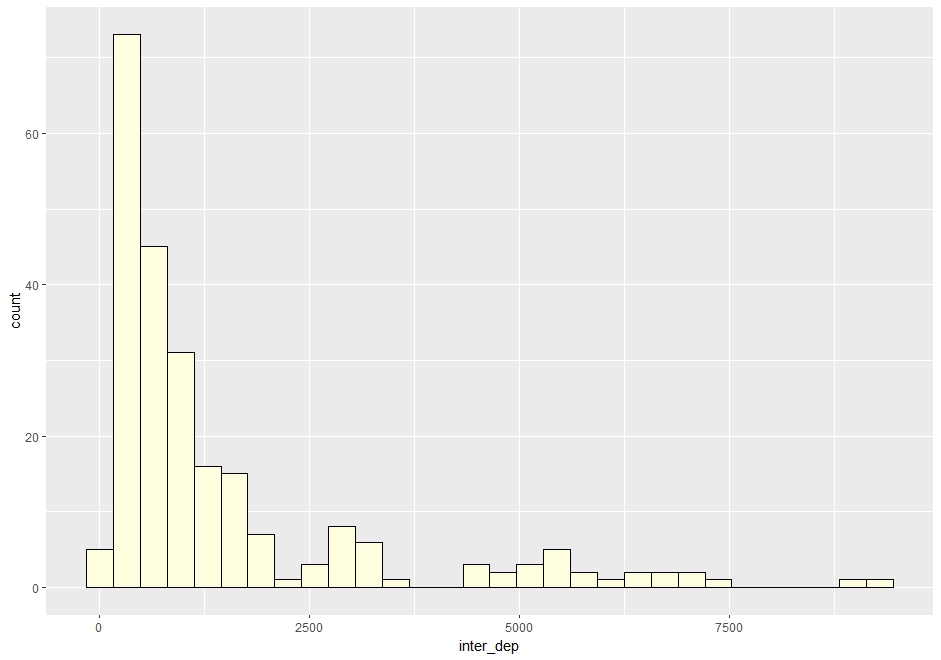
I see inter_dep are alos right skewed.
That's it. Thank you!
Next post is
To read from the first post,