UnsplashのMelissa Askewが撮影した写真

In this post, I will analyzie OECD Crop production data.
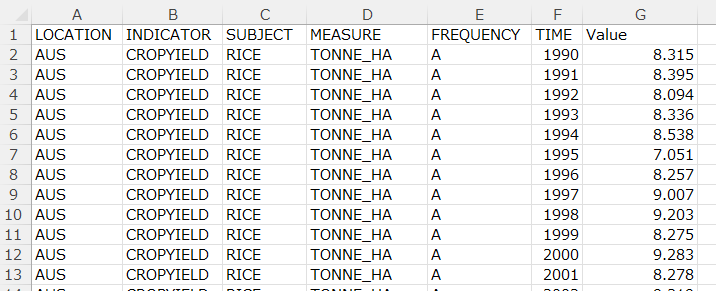
Firstly, I downloaded data from "OECD (2023), Crop production (indicator). doi: 10.1787/49a4e677-en (Accessed on 01 July 2023)"

I use R to analyze the data.
I load tidyverse package.

Next, I use read_csv() fundtion to load the CSV file data into R.

Then, I use skim() function from skimr package to check each varibales data.

I see there are 5 character variables and 2 numerical vatiables in "df_raw" object and there is not any missing observations.
Let's see LOCATION using table() function.

Only CHE has 472 observations and others have 492 observations. So I delete CHE.
![]()
Next, let's see INDICATOR

INDICATOR has only one value, CROPYIELD. I remove INDICATOR.

Next, let's see SUBJECT

There 4 values, MAIZE, RICE, SOYBEAN and WHEAT. They have the same number of observations, 4551.
Next, let's see MEASURE

Thare are three values,
THND_HA means thousand hectares,
THND_TONNE means thousand tonnes,
TONNE_HA means tonnes / hectare.
Next, let's see FREQENCY.

FREQUEANCY has only one value, so I remove FREQUENCY.

Next, let' see TIME

TIME starts from 1900 and 2030, they are 444 observations each year.
Lastly, let's see Value. I want see basic stats for each SUNJECT x MEASURE.

For THND_HA, it is area of fields, WHEAT has the largest mean.
For THND_TONEE, it is volume of crops, MAIZE has the largest mean.
For TONNE_HA, it is volume / area, MAIZE has the largest mean.
That's it. Thank you!
Next post is