This blog is following of
In this blog, I will show you how to get confidence interval with bootstrap method.
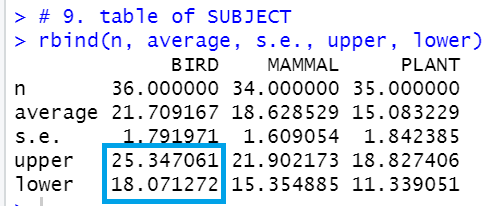
for BIRD, 95% confidence interval is 18.1 ~ 25.3 by parametric calculation.
average ± qt(0.975, d.f.)*S.E.
We will calculate it with bootstrap method.
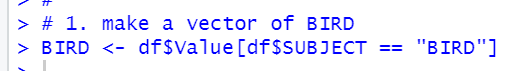
1. make a vector for BIRD.
2. decide how many times calculate average
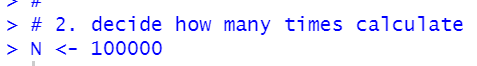
I set it 100,000 times.
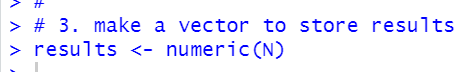
3. make a vector to stroe averages
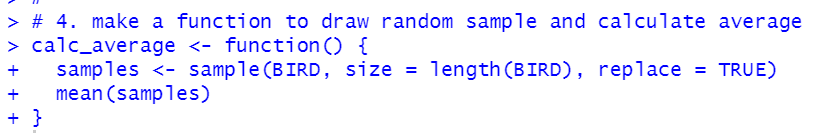
4. make a function to draw random samples and calculate averages.
let's check if the function works well.
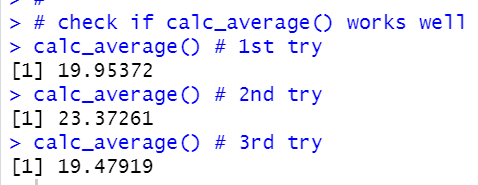
we see 1st, 2nd and 3rd are different value, it means the function works fine.
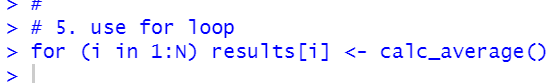
5. use for() function to makes averages.
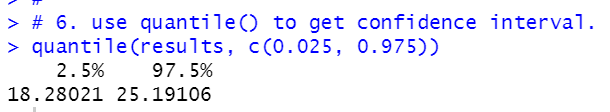
6. use quantile() to get confidence interval
That's it.
Let's make a histogram for results and vertical lines for confidence intervals.
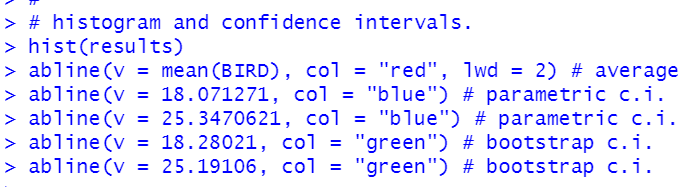
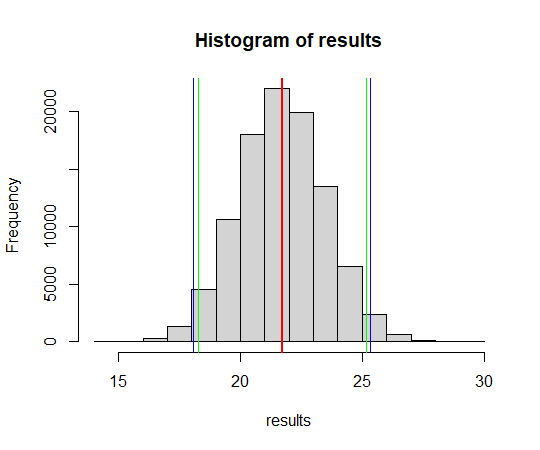
The red vertical line is average,
the blue vertical lines are confidence interval by parametric and
the green vertical lines are confidence interval by bootstrap.
Thank you.
To read the 1st blog,