
Photo by Tobias Keller on Unsplash

This time let's see OECD Dictor's consultations data.
This indicator presents data on the number of consultations patiens have with doctors in a given year.
I download below file from the OECD web site(Health care use - Doctors' consultations - OECD Data)

Let's read this CSV flle with read_csv() function in R.
First, load tidyverse package.

Now, let's use read_csv() function to read the CSV file.

Now using str() function, we can see df structure.
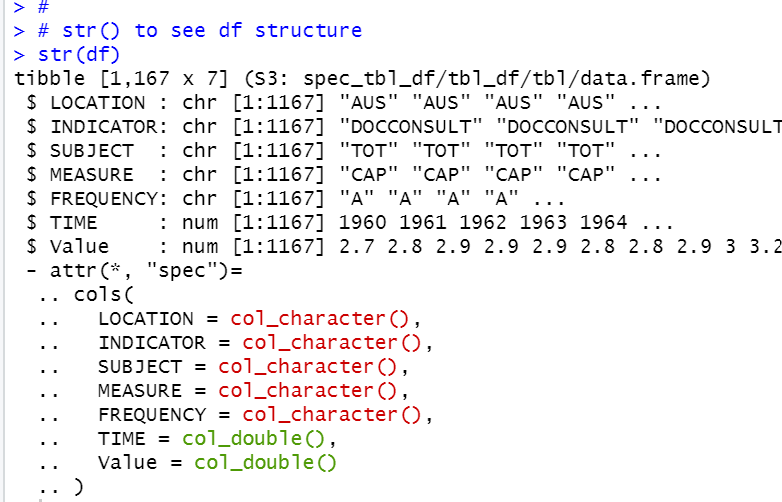
We see we have 1167 observations and 7 columns.
table() functions and length() shows how many different values in variables.

For LOCATION, we have 41 LOCATIONs.
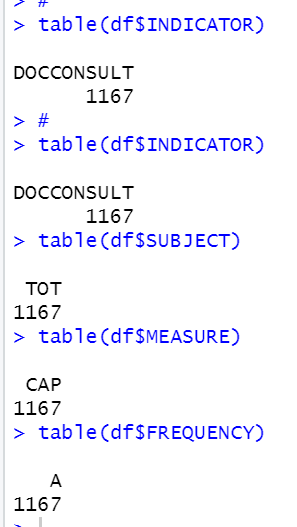
INDICATOR, SUBJECT, MEASURE and FREQUENCY have only one value.
So, we remove those variables.

summary() function shows data frame summary

We can see the oldest time is 1960 and the newest time is 2019. The minimum Value is 0.7 and the maximum value is 16.9, the average value is 5.794.
That's it. Thank you!
Next post is...