
Generated by Bing Image Creator:Lovely photograph of beautiful sunflowers in a city
This post is following of the above post. In the above post, I made a subset data frame, which is balanced panel data.
Let's see time trend of savings for each locations.
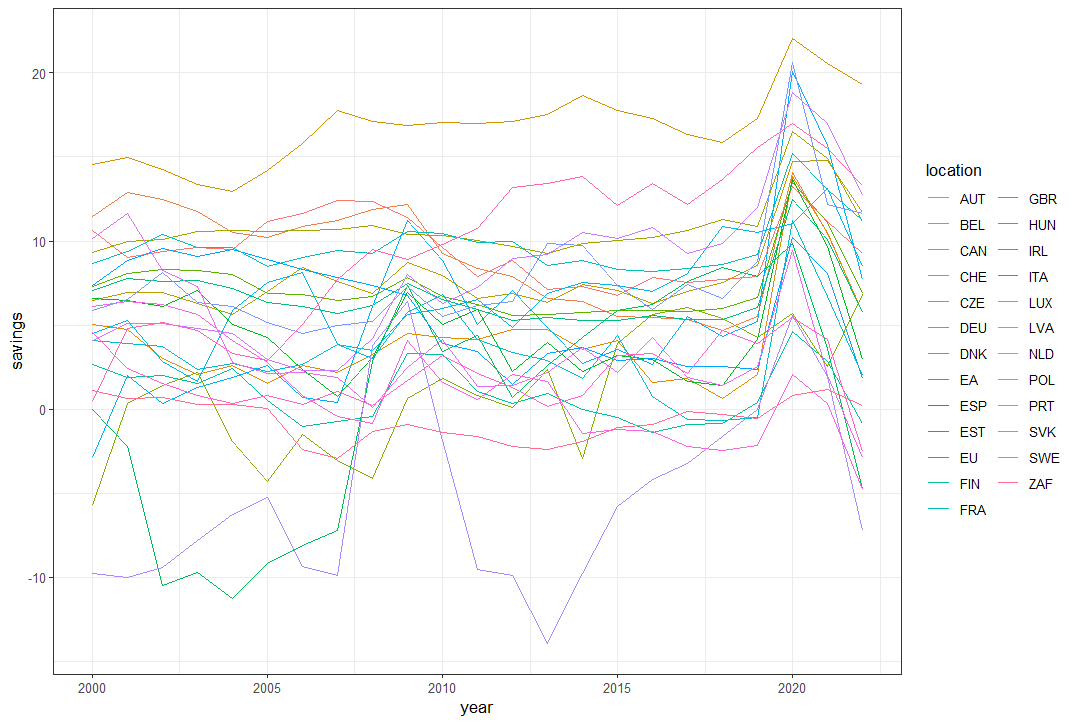
I see savings are not changed so much but in 2020, many locations increased savings.
I assume it is due to COVID-19 pandemic.
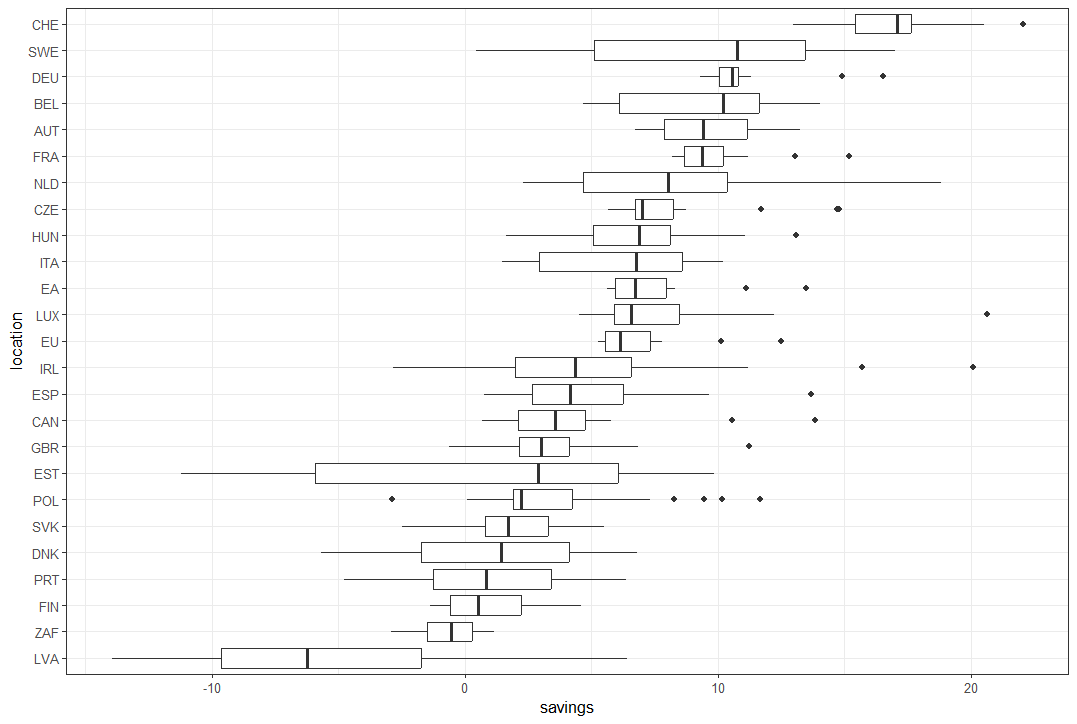
Let's see boxplot by location.

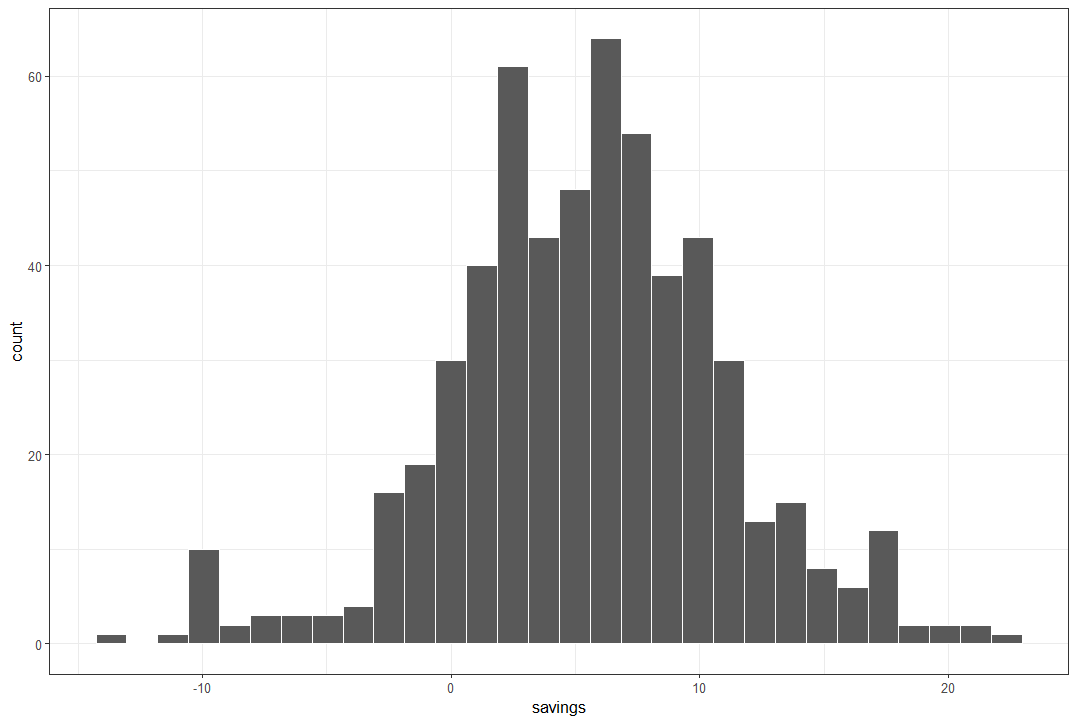
Let's make a histogram for all savings.

All right, now I got some sense of what savings data is like.
Let's do some 'analytical' activity.
According to above time trend chart, I found 2020 is something special. Let's check whether 2020 is really special or not.
First, I make dummy varibale to indicate 2020.
Then, I use linear regression to check whether y2020 is statistically significant or not.

I use summary() function to see the result.
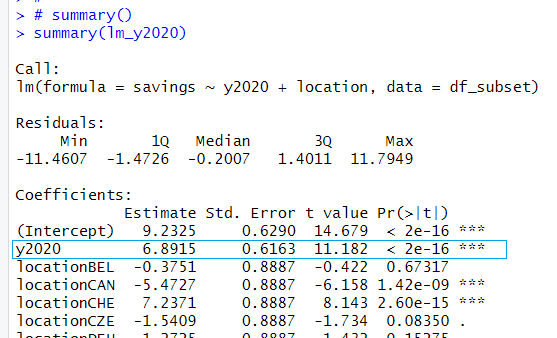
Estimate of y2020 is 6.89 and p-value is almost 0, so y2020 is statistically significant.
In 2020, average savings is higher than other years savings by 6.89.
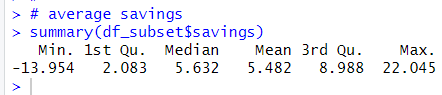
overall average savings is 5.48, so 6.89 is quite large difference.
I can say 2020 is very special year for household savings.
That's it. Thank you!
Next post is
To read from the first post,