
Generated by Bing Image Creator: Beautiful flower bucket, photo
This post is following of the above post. In the previous post, I load Population living in slums data into R. In this post, I will make histograms using R to get sense of how those data are distributed.
First, I make overall histogram.


There seems 2 peaks in the overall distribution.
Next, let's see by Region histogram.


There are 6 regions. Europe and Central Asisa region has low population living in sulums.
Sub_Saharan Africa has high population living in sulums.
Next, let's see by IncomeGroup.


There are 4 income groups. High income groupe has low population, Low income group has high population.
Next, let's see by year

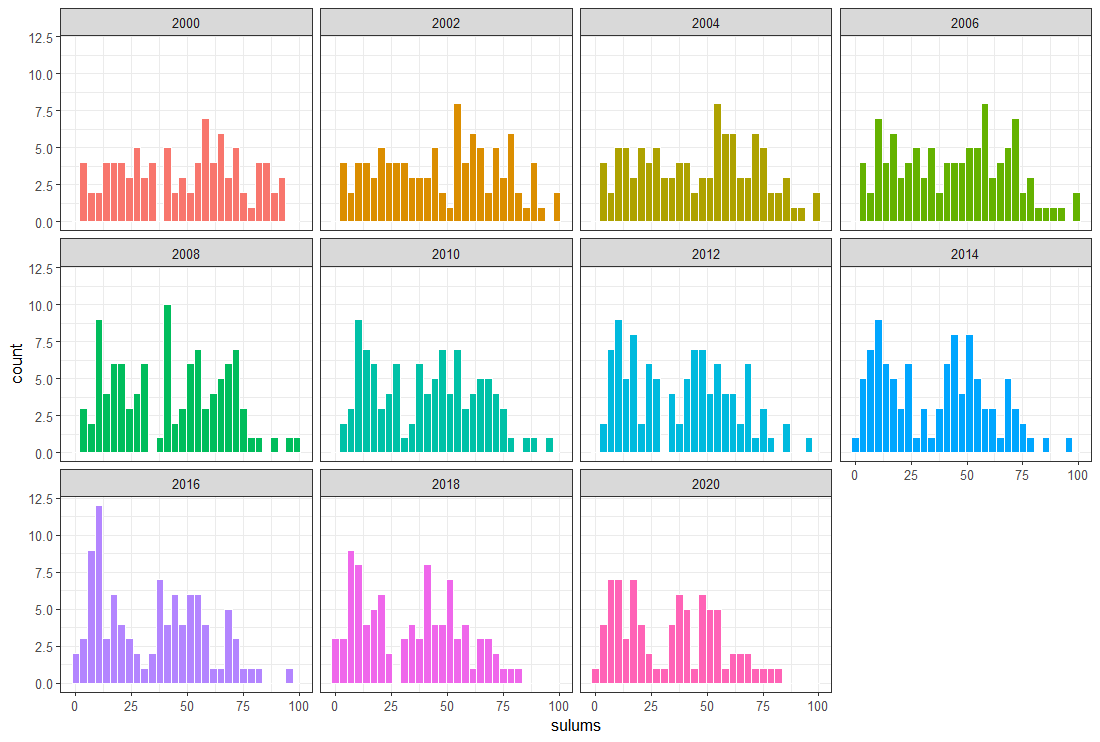
I see data start from 2000 to 2020, every two years. I don't see particular pattern. It seems every years have similar distribution.
Let's see time trend line chart by each country.


It seems over all trend is decreasing. Let's confirm it.


Overall mean population living is slums is degreasing.
To summarize this post,
1. Over all population living in slums has two peak distribution.
2. Sub-Saharan Africa regiion has high population while Europe and Central Asia has low population.
3. Low income group has high population while High income group has low population.
4. Population living is slums is decreasing in the world.
That's it. Thank you!
Next post is
To read from the 1st post,