
UnsplashのLaura Smetsersが撮影した写真
This post is following of the above post.
I will do regression analysis.
Fist, I will do simple linear regression analysis.
I use SELFEMPLOYEMENT as a dependent variable and EMPLOYEE as an independent vatiable. I use lm() function with R.
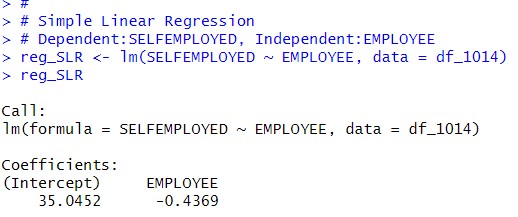
Slope paramter is -0.4369.
Let's see summary data of the reg_SLR.
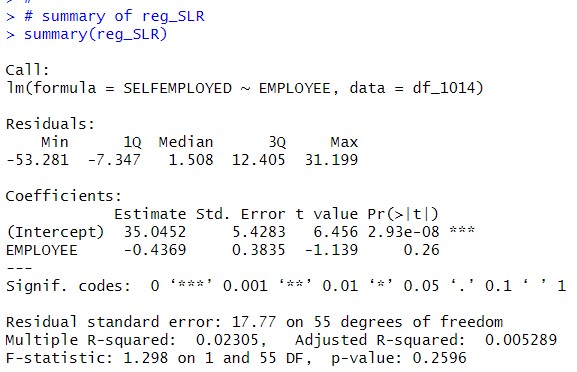
I see Standard Error of EMPLOYEE is o.3835, t-value is -1.139 and p-value is 0.26.
So, I can say EMPLOYEE is not statistically significant.
Let's calculate EMPLOYEE confidence interval. From above summary table, degrees of freedom is 55.
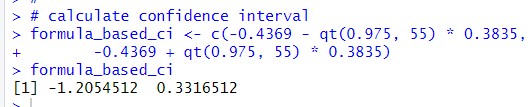
Lower confidence interval is -1.21 and Upper confidence interval is 0.332. Thus, the confidence interval includes 0. So, slope paramtert of EMPLOYEE is not statistically significant.
I use infer package to get the seame results.
First, I get slope_hat.
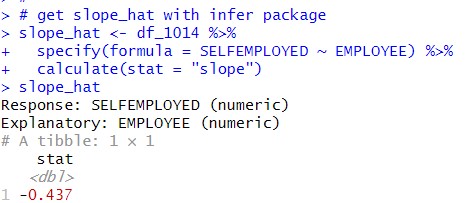
-0.437 is the exactly same figure as lm() function's estimate.
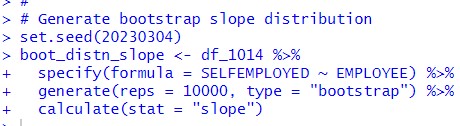
Then, I generate booststap distribution of slope.
Then, use get_confidence_interval().
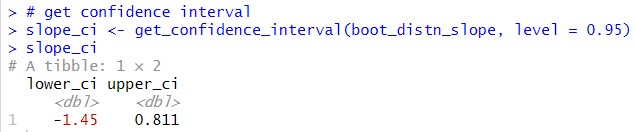
I see 95% confidence interval of EMPLOYEE is from -1.45 to 0.811. This confidence interval is wider than lm() function's (theory based or formula based) cinfidence interval.
Let's visualize it.
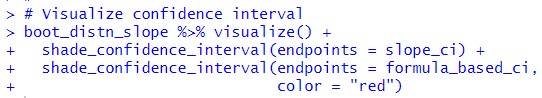
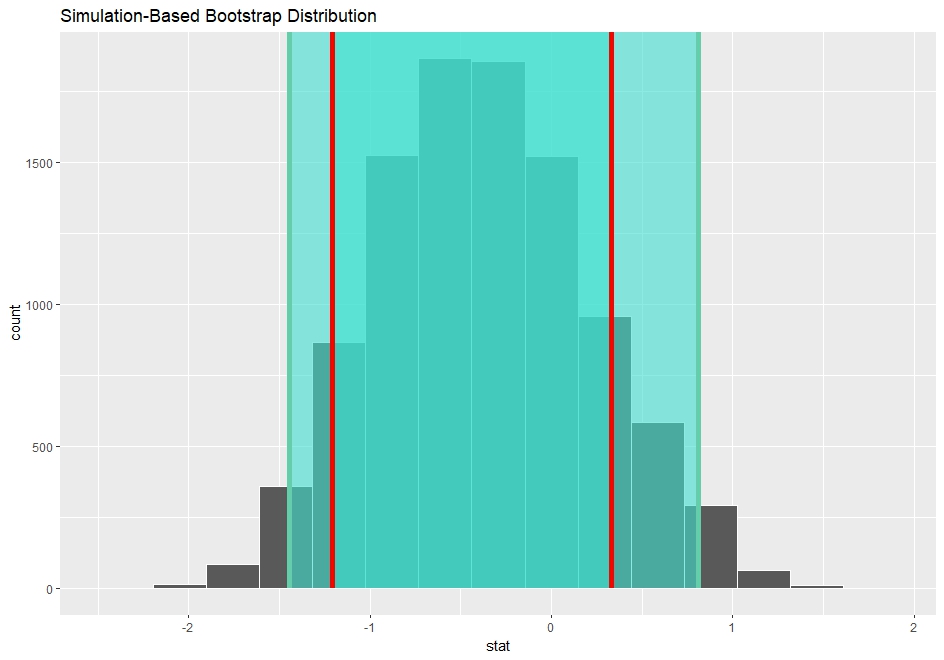
Green vertical line is simulation based confidence interval and red vertical line is formula based(theory based) confidence interval. The both confidence interval is including 0.
So, I can say EMPLOYEE is not statistically significant with 95% confidence.
That's it. Thank you!
Next post is
To read the 1st post,