
Generated by Bing Image Creator: Long view from far, small creek, a few trees, one side road along with beautiful flowers, blue sky and white clouds, photo
This post is followng of the above post.
In this post, I will do simulation based multiple regression analysis with R infer package.
To begin with, I get formula based 95% confidence intervals.
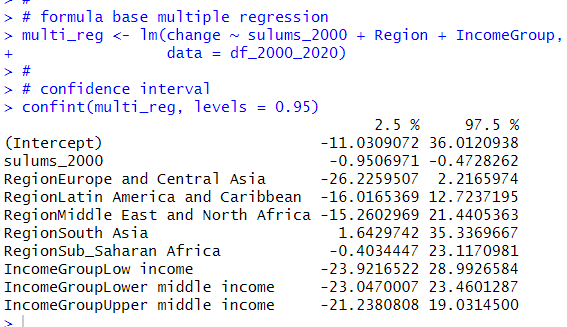
I find sulums_2000 and Region South Asia confidence interval don't include 0.
So, those two variables are statistically significant.
When Regin and IncomeGroup are controled, sulums_2000 is statistically significant variable.
When sulums_2000 and IncomeGroup are controled, Region South Asia is statistically significant different from Region East Asia and Pacific.
Next, let's do simulation based multiple regression.
I start with getting obserbed fit.
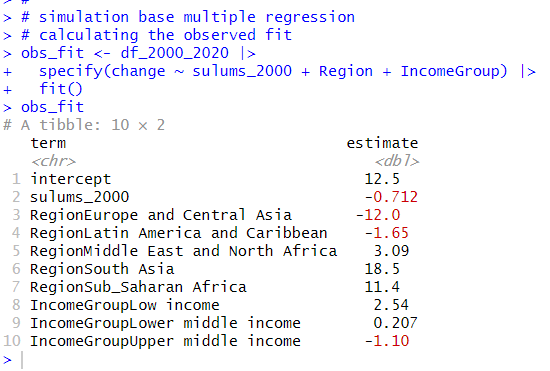
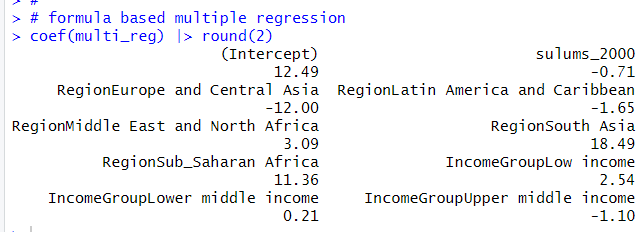
This is the same as formula based multiple regression.
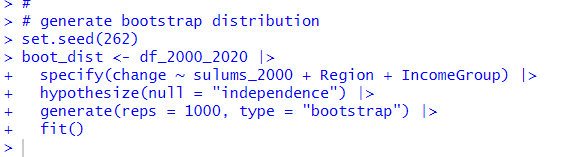
Next, I generate bootstrap distribution.
I get confidence interval.
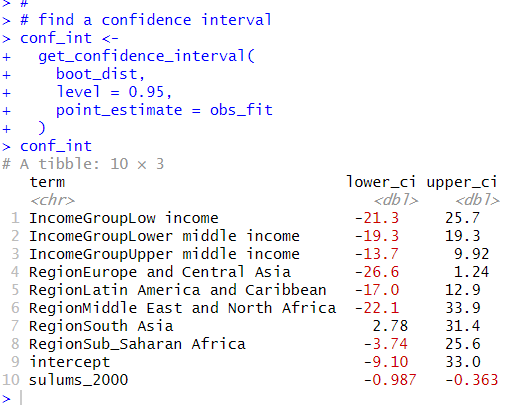
sulums_2000 and Region South Asia don't include 0. The results is the same as formula based confidence interval.
Let's visualize confidence interval.
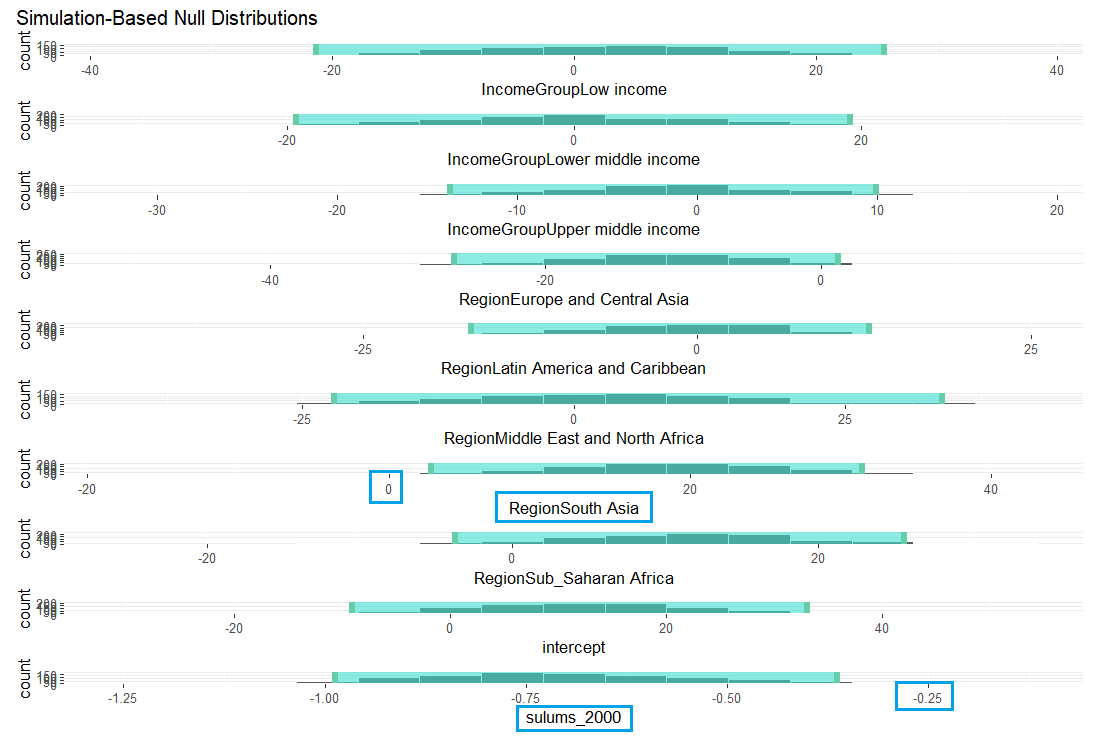
You:ll see confidence intervals of Region South Asia and sulums_2000 don't include 0.
I make histogram for sulums_2000 bootstrap distribution with confidence interval.
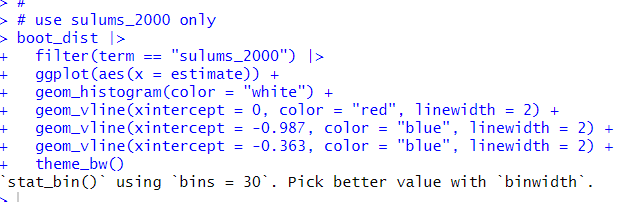
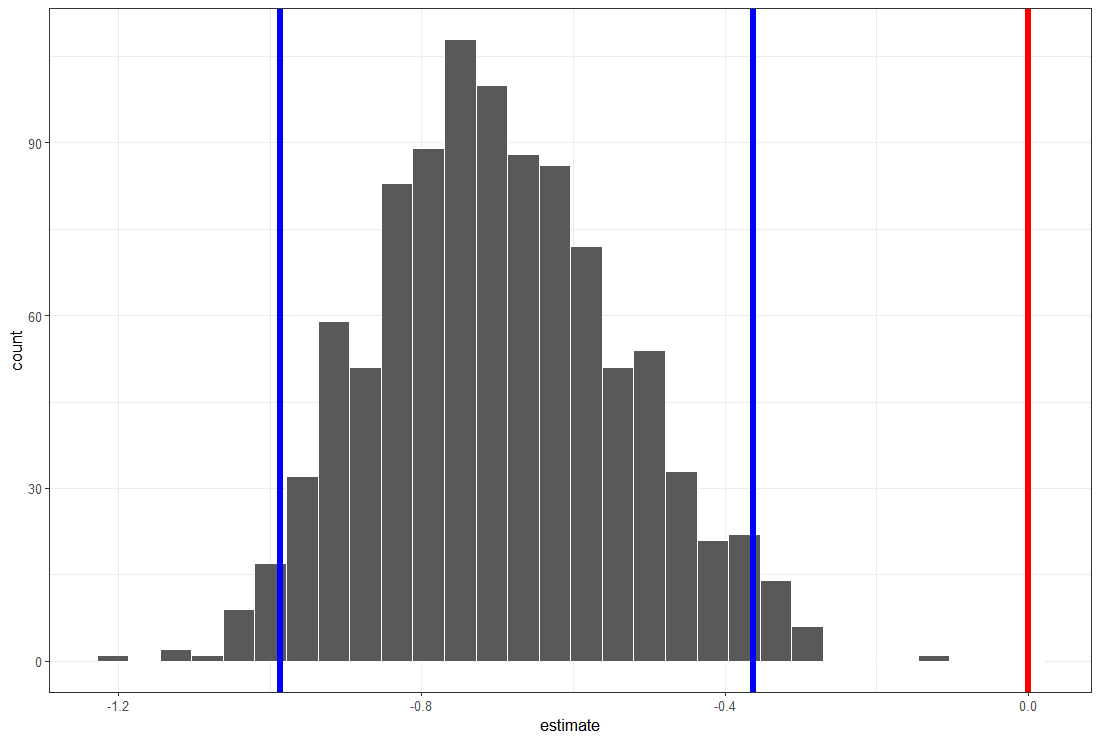
The red vertical line is at 0 and blue vertical lines are confidence interval. You:ll see confidence interval does not include 0.
In the previous post, I did simple ANOVA analysis to see change and Region relationship and I get there is not statistically significant relationship, but in this post, when I control other variables, change and IncomeGroup, I found Region and change have statistically significant relationship.
That's it! Thank you!
Next post is
To read from the first post,