
(Bing Image Creator で生成: プロンプト: Closeup of flowering blue and pink roses, background is white clouds, photo)
の続きです。
今回は、ナイーブ・ベイズ(Naive Bayes)で予測します。
e1071 パッケージの naiveBayes() 関数で簡単に実行できます。
naiveBayes() 関数を使います。
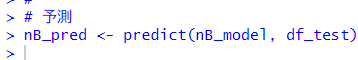
predict() 関数で予測します。
tables() 関数で結果を確認しましょう。
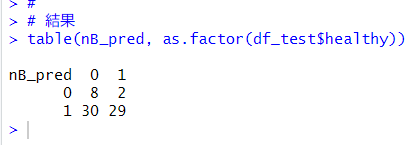
正解率を計算します。
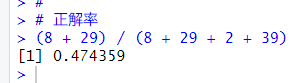
正解率は 47.4% でした。これはデタラメ予測の平均値の 51% よりも悪いですね。
ナイーブ・ベイズではうまく予測はできませんでした。
はじめから読むには、
です。
今回のコードは以下になります。
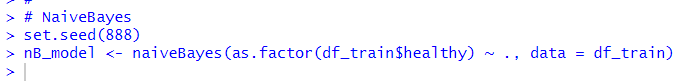
#
# e1071の読み込み
library(e1071)
#
# NaiveBayes
set.seed(888)
nB_model <- naiveBayes(as.factor(df_train$healthy) ~ ., data = df_train)
#
# 予測
nB_pred <- predict(nB_model, df_test)
#
# 結果
table(nB_pred, as.factor(df_test$healthy))
#
# 正解率
(8 + 29) / (8 + 29 + 2 + 39)
#