
In this BLOG series, I will investigae NEET data.
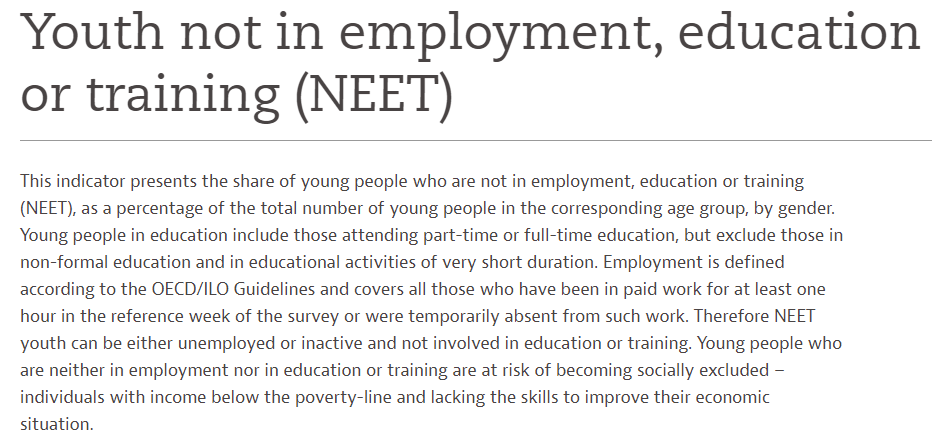
Firstly, I get data from OECD web site.
CSV file is like below.

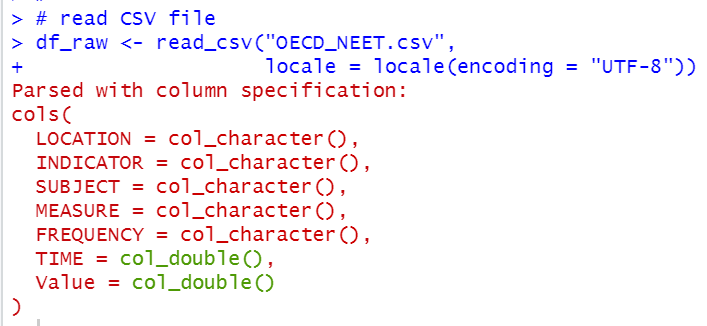
Let's load this data into R.
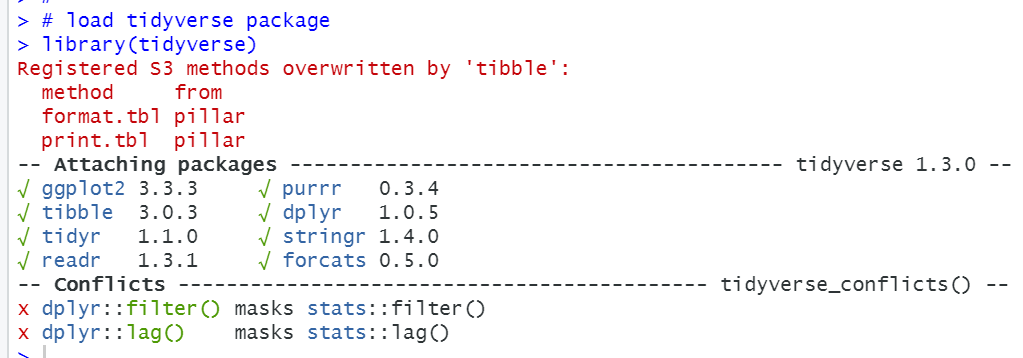
Firstly, I load tidyverse package and will use read_csv function.


All right, let's check each variables.

LOCATION is country code. We see some countries has over 200 observations and some countries has less than 100 obervations.

INDICATOR has onry one value, NEET, so we can delete this variable from the dataframe.


We see SUBJECT has many values. So, I change SUBJECT to factor from character.

Oh, I forgot to change LOCATION to factor class.


MEASURE has only one value, PC_AGE. So we can delete MEASURE.


There is only one value in FREQUENCY, it is A. So we can remove it.


TIME is numeric data. Minimum value is 1997 and max value is 2020. So, we have approximately 20 years history.

Value is NEET percentage. It is surprising the max value is 66%. There is a country 66% young people is NEET!
Lest's use summary function for dataframe, df.

All right, we deleted unnecessary variables and changed character class variables to factor class.
That's it. Thank you!
Next post is