
UnsplashのMarek Piwnickiが撮影した写真

In this post, I will analyze OECD Researchers data.
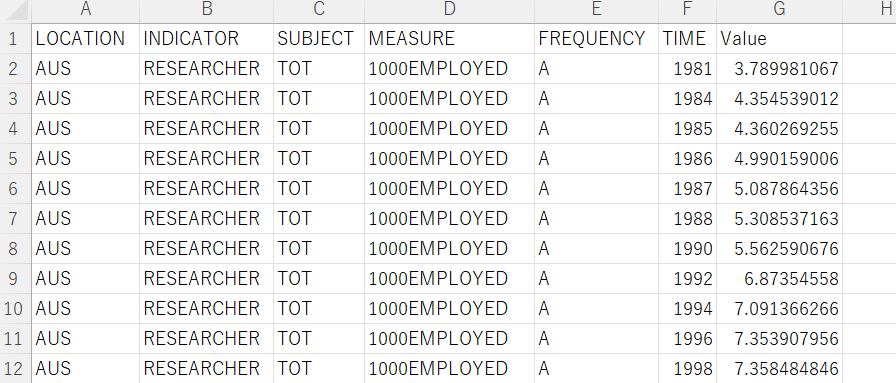
Researchers are professionals engaged in the conception or creation of new knowledge, products, processes, methos and systems, as well as in the management of the projecs concerned. This indicator is measured in per 1000 people employed and in number of researchers, the data are available as a total and broken down by gender.
From the OECD website, (Research and development (R&D) - Researchers - OECD Data), I get the CSV file like above.
I also get the GDP data from the OECD website, (GDP and spending - Gross domestic product (GDP) - OECD Data).

Let's analyze(play around) those data with R!
Firstly, I load tidyverse package and moderndive package because I am reading Statistical Inference via Data Science (moderndive.com) and I am planning to follow this book.

Next, load data files.
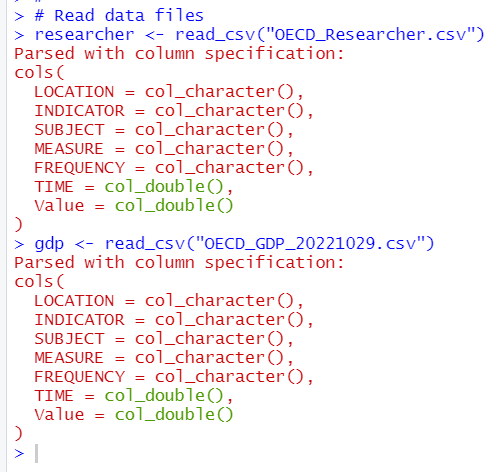
I use glimpse() function to see data.

The both dataframe have the same variable names.
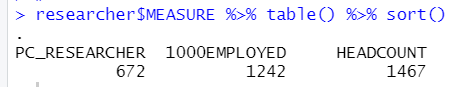
let's check each variables.
I start with researcher's LOCATION

researcher's INDICATOR

researcher's INDICATOR has only one value: RESEARCHER, so I can remove it.


researcher's FREQUENCY has only one value: A. I can remove it.

Time is from 1981 to 2020. 2011 has the most observations, 150.

All right, let's remove INDICATOR and FREQUENCY from researcher dataframe and rename variables.

Let's see researcher_v2 with glimpse() function.

All right. Let's call it a day. Thank you!
Next post is,