
Photo by Chris Briggs on Unsplash
This post is following of above post.
There are many SUBJECTs, so let's focus 15_29 first. It is NEET percentage among 15_29 old young people.
Firstly, let's see a histogram.

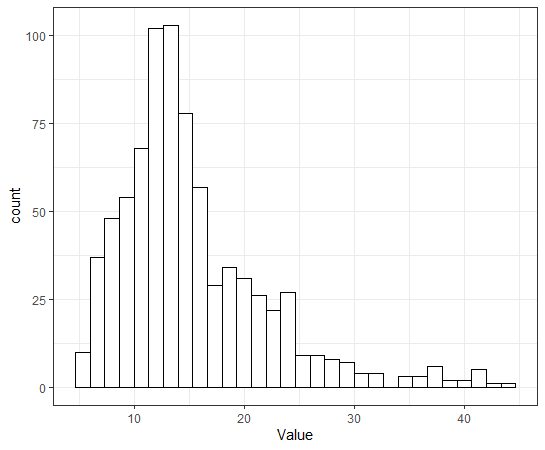
There is a peak at around 14.
Let's see summary statistics.

Mean is 15.276 and Median is 13.537.
15_29 is divided to MEN and WOMEN.
Let's see them.

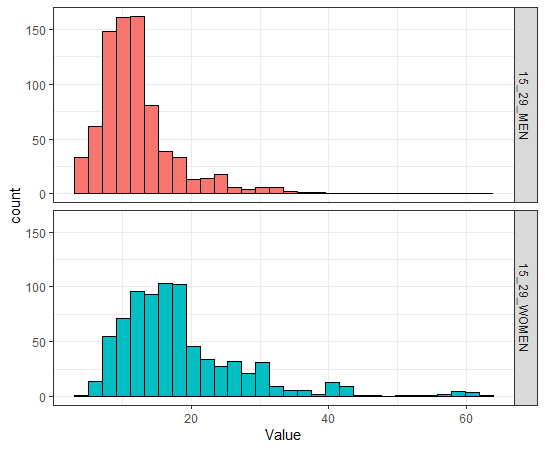
We see 15_29_WOMEN is higher than 15_29_MEN.
Let's see summary stats.

15_29_MEN average is 12.0 while WOMEN average is 18.6.
Let's see this differnece is statistically significant.
We can do it with t-test.
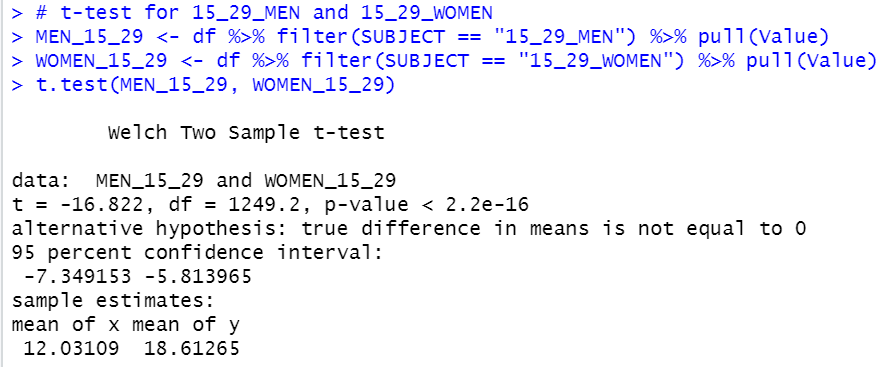
p-value is < 2.2e-16. So, 15_29_WOMEN is statistical significantly higher than 15_29_MEN.
That's it. Thank you!
Next post is
To read the 1st post,