
This post is gollowing of the above post.
In this post, I will do regression analysis using R.
I will check if GDP, per capita GDP are statistically significant factor to NEET percentage.
First, let's check which year has the most observations.

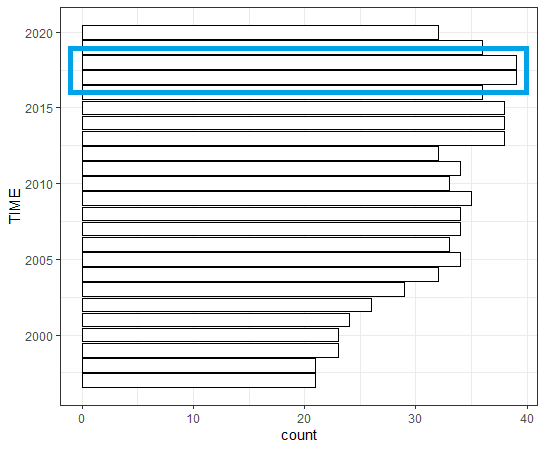
2017 and 2018 have the most observations.
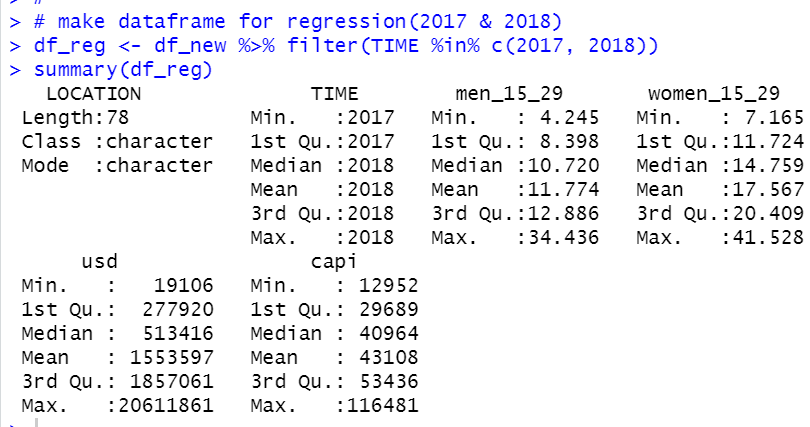
So, I will make a dataframe with 2017 and 2018 for regression analysis.
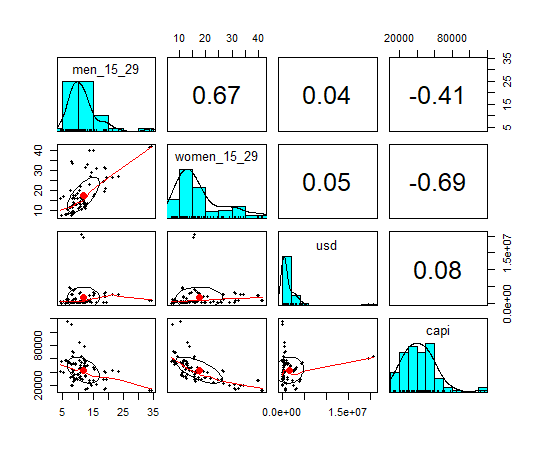
Let's see correlations between variables.
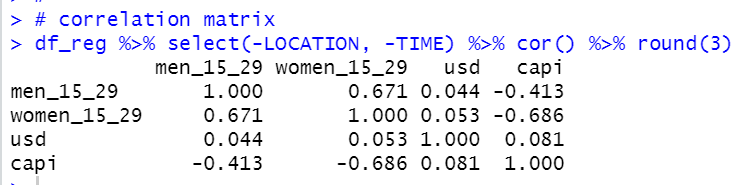
capi: per capita GDP has negative correlation to the both men_15_29 and women_15_29.
It is very interesting.
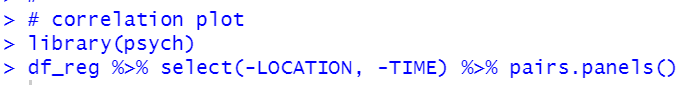
Let's see correlation plot using pairs.panles() function of psych packages.
usd: GDP amount distribution is very skewd, maybe it is better to transform to logarithm.
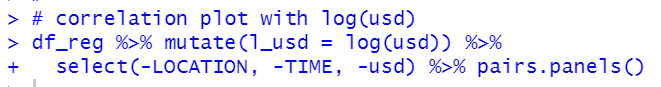
Now, it looks better.
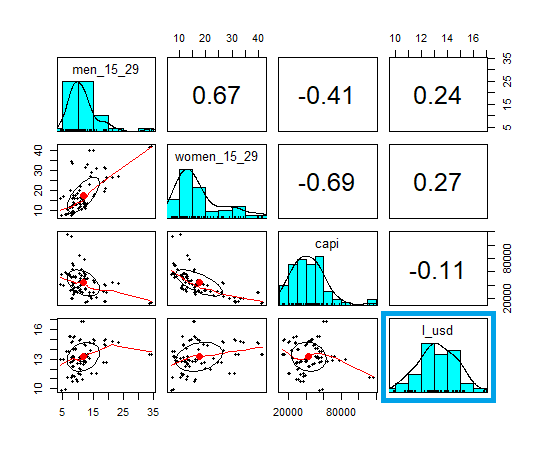
All right, let's do regression analysis using lm() function with R.
I use log(usd) instead of usd.
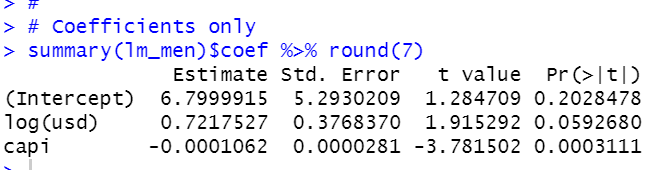
capi has statistically significant coefficient. Its sigine is negative. It means that the higher capi, the lower the percentage of NEET. It makes sence. log(usd) is weak statistically significant and its signe is positive. It means that the larger GDP, the higher the percentage of NEET. It is interesting.
Let's display coefficient only.
Now, let's see women_15_29.
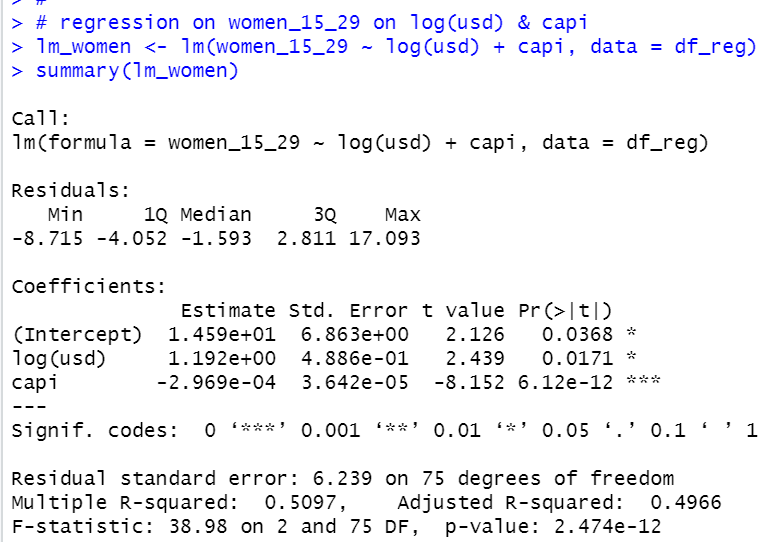
As well as men_15_29, capi has negative statistically coefficient and log(usd) has positive statistically coefficient.
Let's display coefficients only.
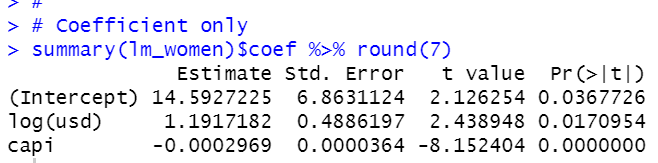
women_15_29 is more sensitive than men_15_29 for capi and log(usd).
It is very interesting that large amount GDP cause higher NEET percentage while high per capita GDP lowers NEET percentage.
That's it. Thank you!
Next post is
To read from the 1st post,