
Photo by Jonas Allert on Unsplash
This post is following of the above post.
In this post I will try panel data analysis, FD(First Differenced) estimator.
I refere to "Using R for Introductory Econometrics" by Florian Heisis.

And Introductory Econometrics A Modern Approach by Jeffery M. Wooldridge

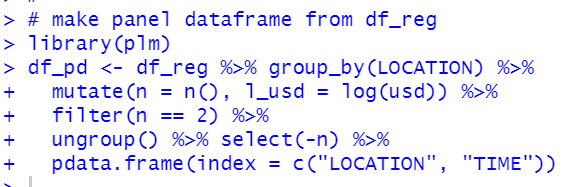
Firstly, let's make panel data for regression.
To make a panel data frame, I used pdata.frame() function in plm package.
Let's see what looks like df_pd.
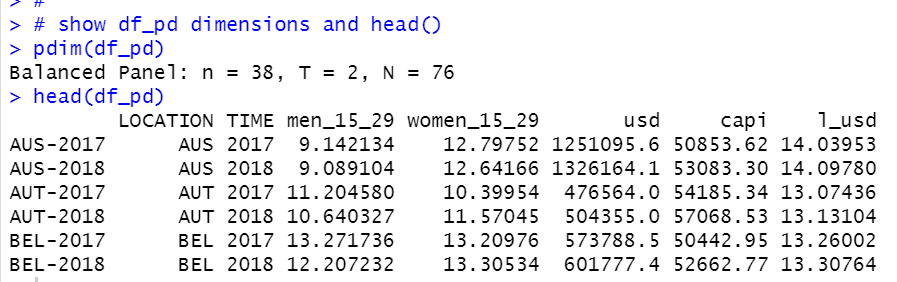
pdim() functions tells df_pd is Balanced Panel data and n = 38, T = 2, N = 76.
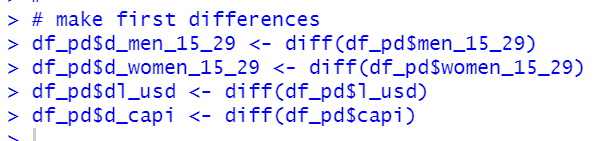
To do FD(First Differenced) estimate, I make differenced variables using diff() function.
Let's see new variables.
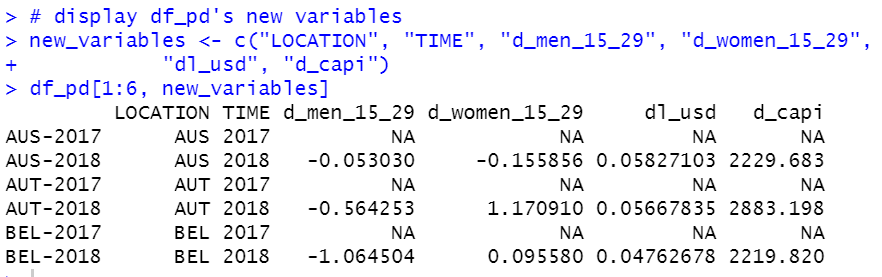
Year 2017 values are NA.
Now, let's do FD estimate.
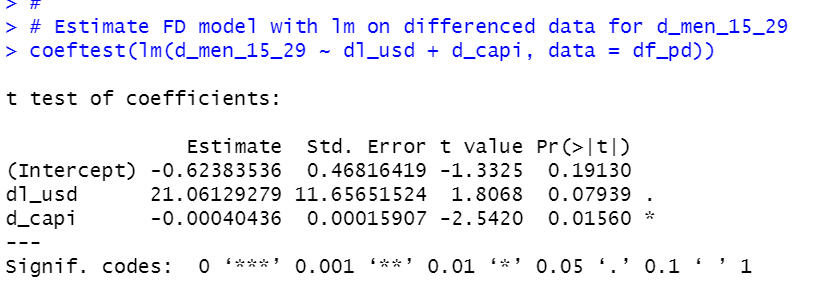
For d_men_15_29, if d_capi is positive, d_men_15_29 is negative, if dl_usd ispositive, d_men_15_29 is positive. This means per capita GDP growth makes lower NEET percentage, GDP amout growth makes higher NEET percentage.
Let's use plm with original data. I use model ="fd".
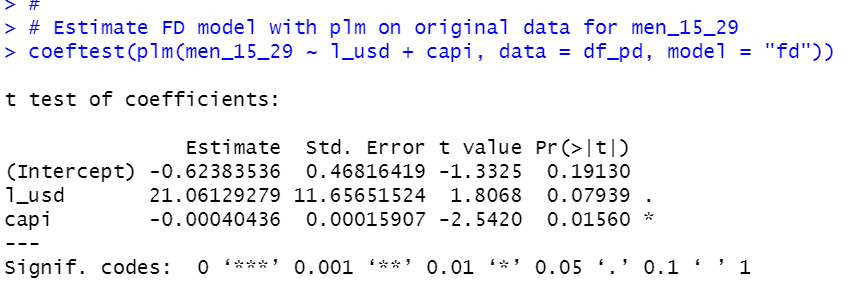
Of course, the result is identical with previous one.
Okay, let's move on for women_15_29.
First, lm() function with differneced variables.
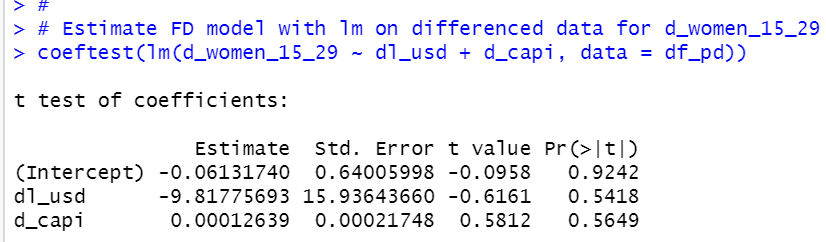
dl_usd and d_capi are both statistically in significant.
Let's check jount siginificance.
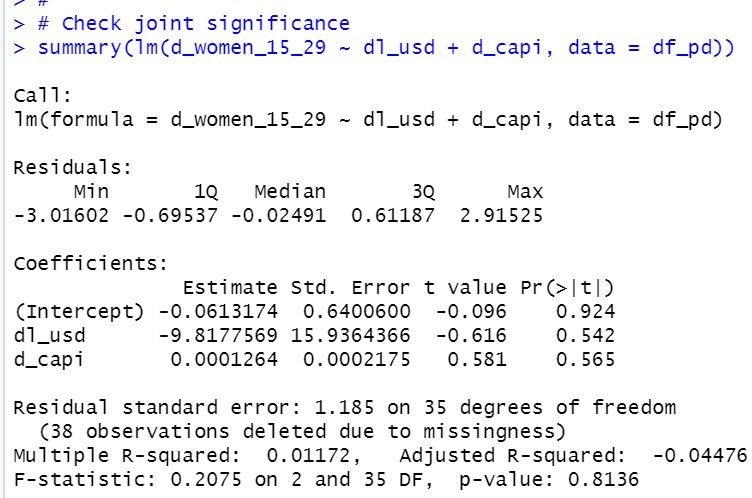
p-value is 0.8136, so dl_usd and d_capi are not jointly significant to d_women_15_29.
Let's see plm function.
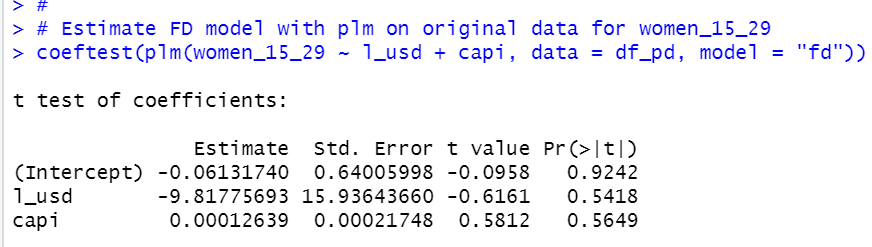
It is identical with lm on differenced data.
It is intersting men's NEET percentage differnece is related to GDP and per capita GDP difference while women's NEET percentage is not related to.
That's all. Thank you!
To read from the 1st post,