
This post follows above post.
In this post, I will do panel data regression analysis with R using plm package.
First, le's see which year has many observations.
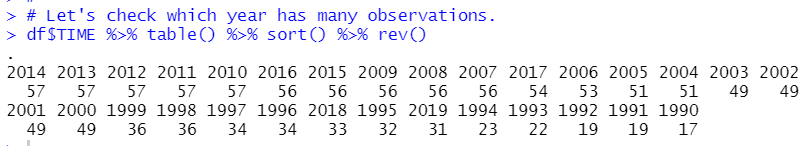
2010, 2011, 2012, 2013 and 2014 have 57 observations. I use 2010 and 2014 data for panel data analysys.
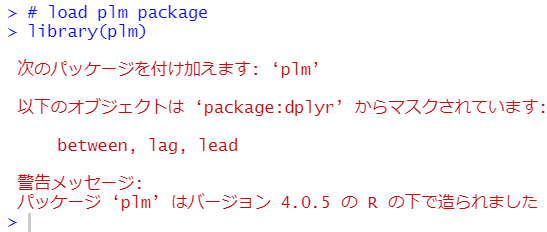
I load plm package first.
I use panel dataframe with pdata.frame function
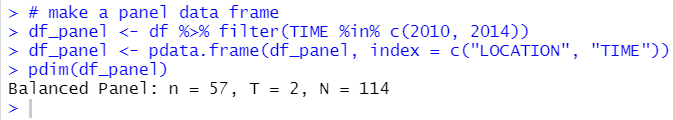
pdim() functions shows panel dataframe structure. We see our panel dataframe is balanced panel data, n = 57, T = 2, N = 57*2 = 114.
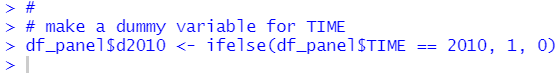
I will make dummy variable if TIME = 2010, 1 otherwise = 0
Then, let's begin with pooled cross section model.
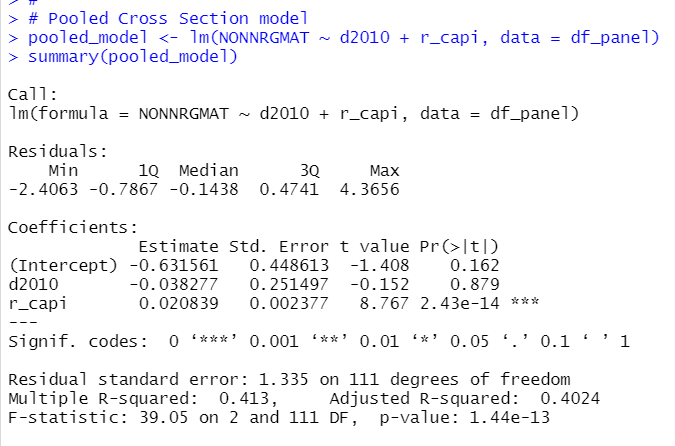
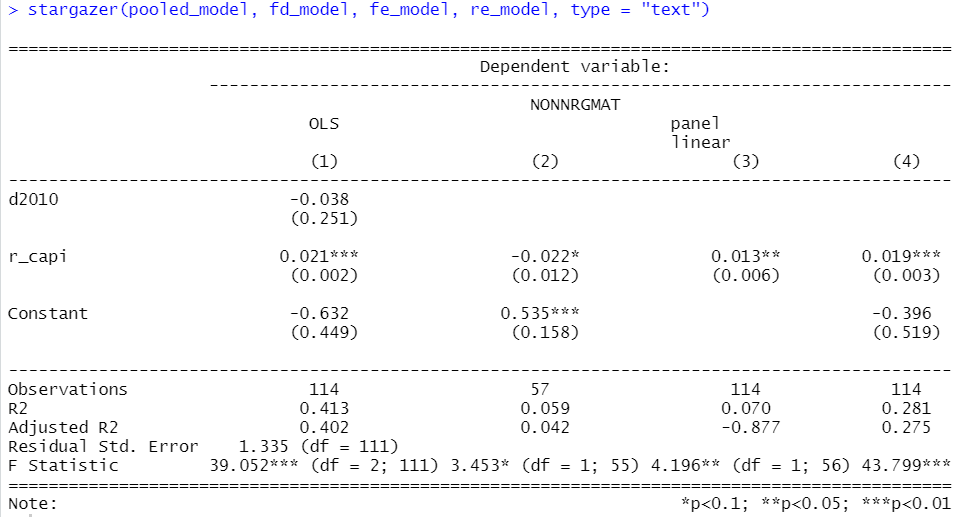
We see r_capi has 0.02 coefficient and strongly significent.
Next, we do First Differenced Estimator.
I have underluing model in mind, which model is following.
y_it = beta_0 + beta_1*d2010 + beta_2*r_capi_it + a_i + u_it
i indicates each LOCATION, t indicates TIME, 2010 or 2014. a_i is unobserved effect, which is the same in 2010 and in 2014(so, there is not 't').
So, for 2010,
NONNRGMAT_i2010 = beta_0 + beta_1*d2010 + beta_2*r_capi_i2010 + a_i + u_i2010 >>> formula_2010
For 2014,
NONNRGMAT_i2014 = beta_0 + beta_2*r_capi_i2014 + a_i + u_i2014. >>> formula_2014
formula_2014 - formula_2010 =
NONNRGMAT_i2014 - NONNRGMAT_i2010 = ΔNONNRGMAT_i = -beta_1 + beta_2*Δr_capi_i + Δu_i >>> formula_fd
In formula_fd, there is not unobserved effect, a_i.
We can do above estimate with plm() function with model = "fd".
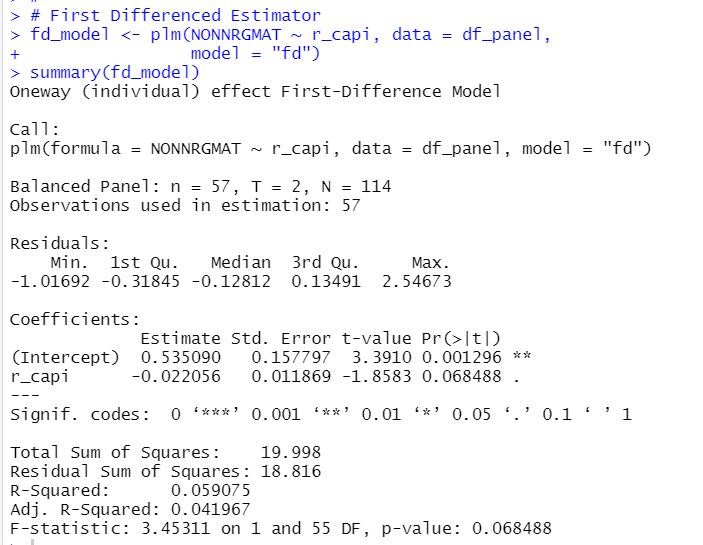
r_capi coeeficient turns into negative, -0.022 and it is not significant at 5% level.
model = "within" makes Fixed Effects Estimator, in two time panel data, it is almost the same as FIrst Differenced Estimator. Let's do it.
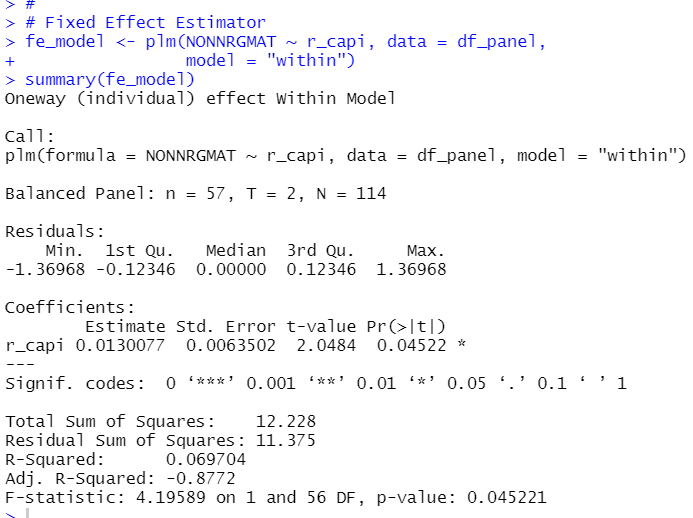
r_capi coefficient is 0.013 and significant.
model = "random" makes Random Effect Estimator. Ler's fo it.
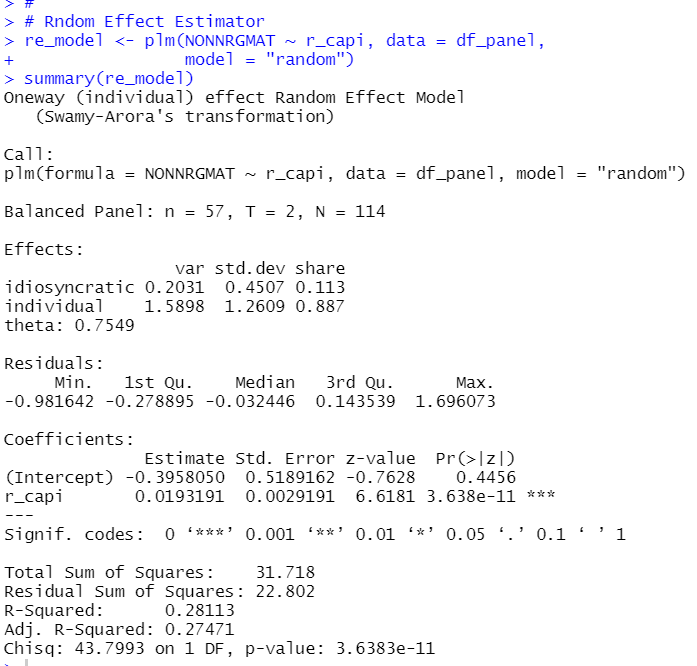
r_capi coefficient is 0.019 and significant.
Lastly, I use stargazer() function to compare 4 estimator results.
That's it. Thank you!
To read the 1st post,