
Photo by Ken Cheung on Unsplash
This post follows above post.
I add trend variable to static model.
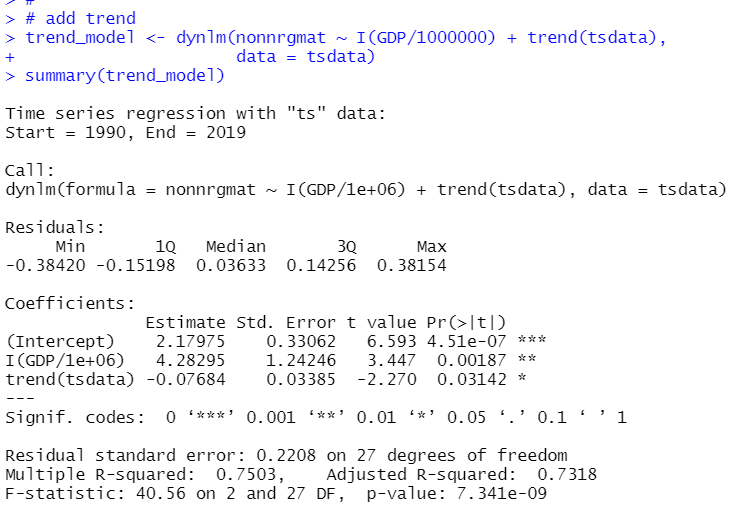
Althogh adding trend, GDP is still significant.
So, I make three model, static model, finite distributed lag model and static + trend model.
Let's check if there is serial correlation in those models.
Firstly, let's make graphs for residuals.
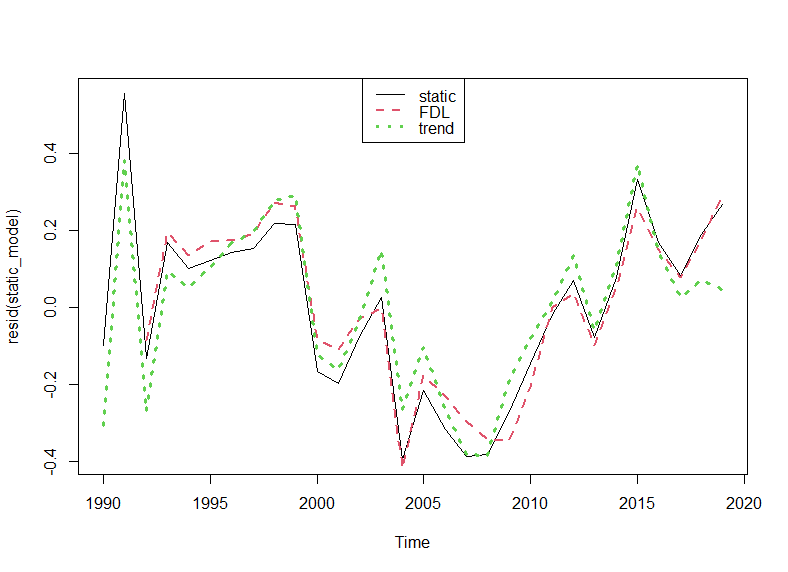
All three residuals are very similar and it seems there is serial correlation.
Let's test with dynlm() function and coeftest() fundtion.
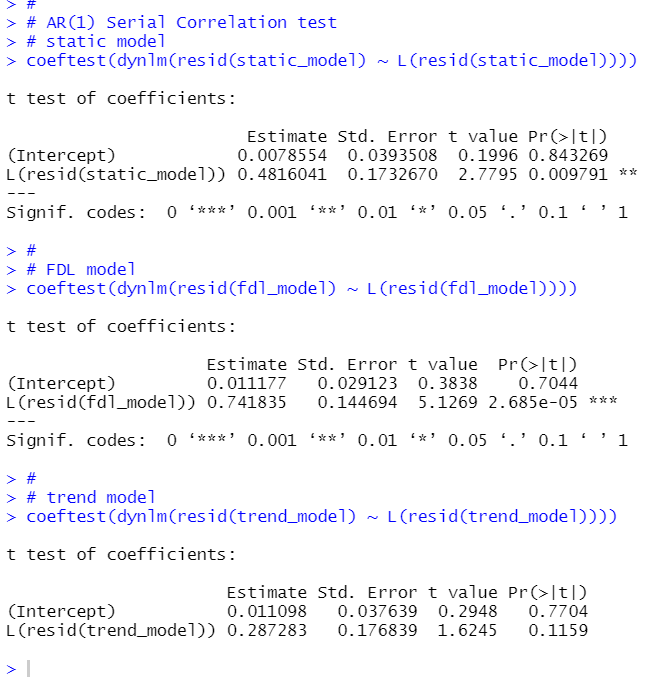
static_model and fdl_model have p-value less than 0.01, so the both model have AR(1) serial correlation. static + trend model p-value is 0.1159, so it seems that static + trend model does not have serial correlation.
Next, let's test if there is AR(2) serial correlation in static + trend model.
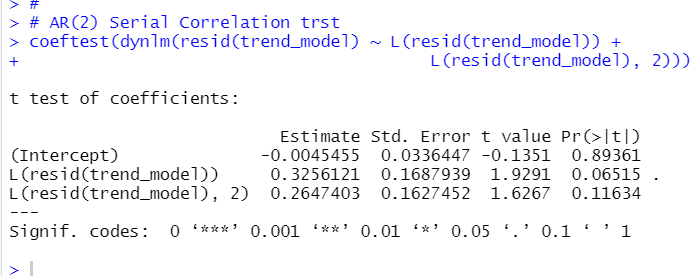
first lag has very small p-value, 0.06515, but it is still grater than 0.05. I don't reject null hypothese:there is not serial correlation at 5% significant level.
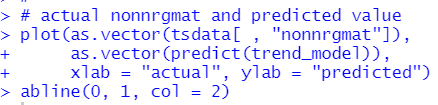
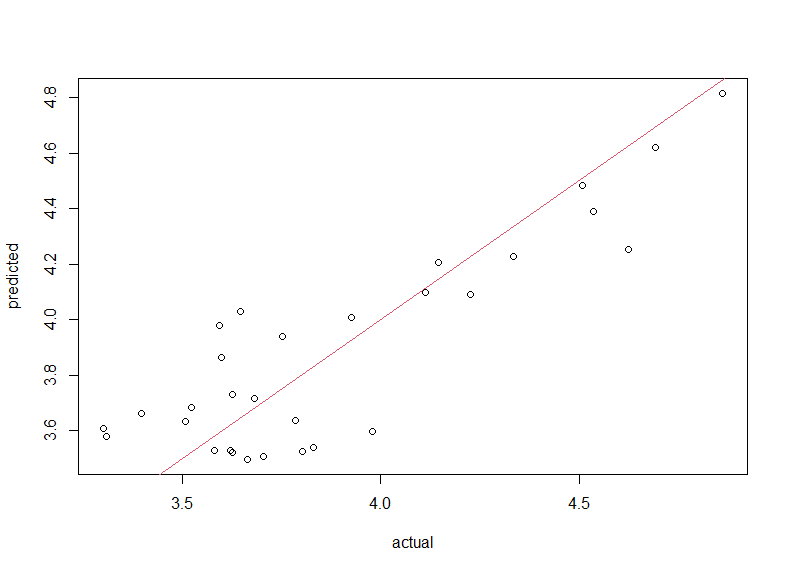
Finally, let's plot actual nonnrgmat and static + trend model predict value.
That's it. Thank you!
The next post is
For the 1st post,