
Photo by Toni Lluch on Unsplash
This post is following of above post.
In this post I will do Bootstrap and make confidence inerval of regression.
First, let's check coefficients for static regression model again.
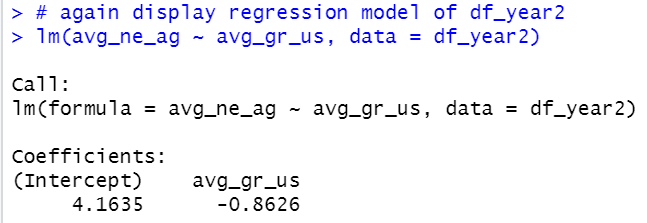
Intercept is 4.1635, avg_gr_us is -0.8626.
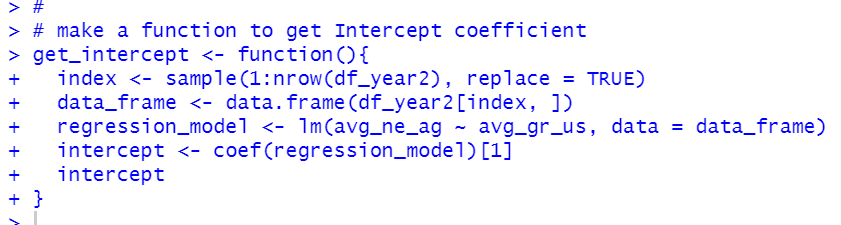
Then, I make a custom function to get intercept.
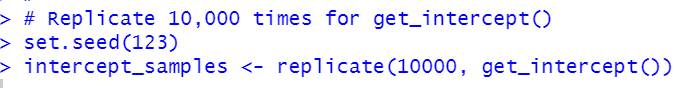
Next, I replicate 10,000 times to get intercept.
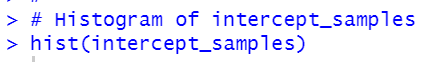
Let's see a histogram of intercept_samples.
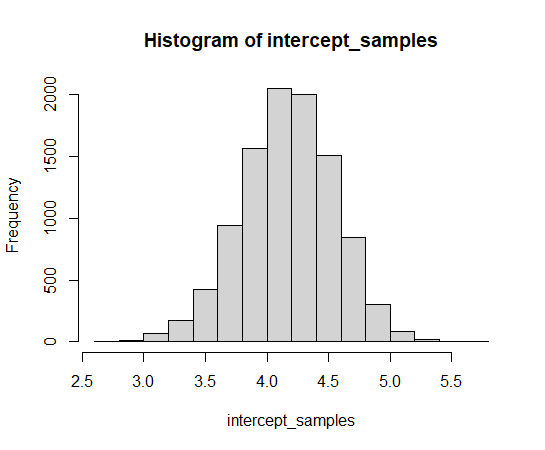
Now, we can get 95% confidence interval and mean.
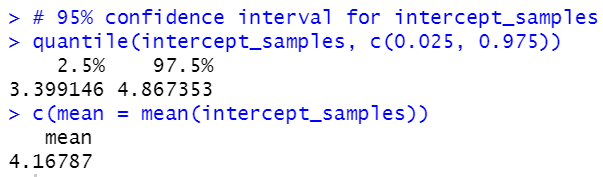
Our regression model's intercept is 4.1635. So, bootstrap gets very close intercept value.
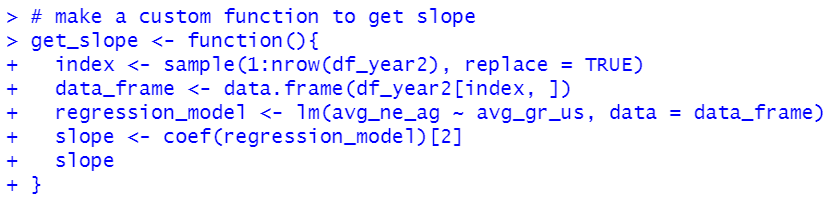
We can do the same procedure about slope.
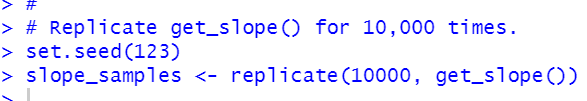
I replicate 10,000 times for get_slope().
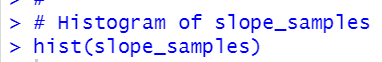
Let's see a histogram.
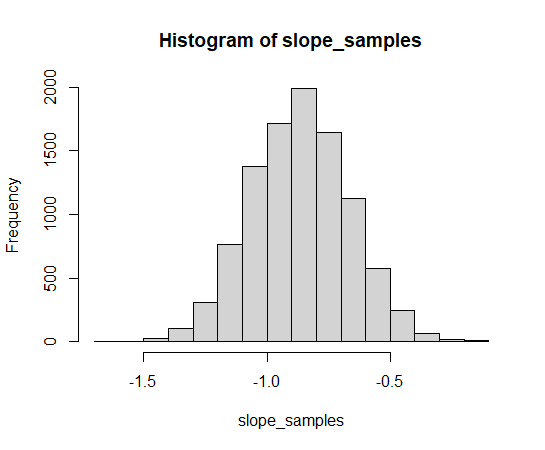
Now, I can get 95% confidence interval and mean value.
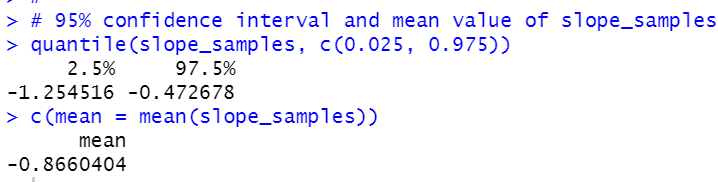
Our regression model's slope is -0.8626. So, bootstrap slope is very close to it.
That's it. Thank you!
To read the fist post,