
Photo by Bob Brewer on Unsplash
In this post, I will analyze OECD Household disposable income.
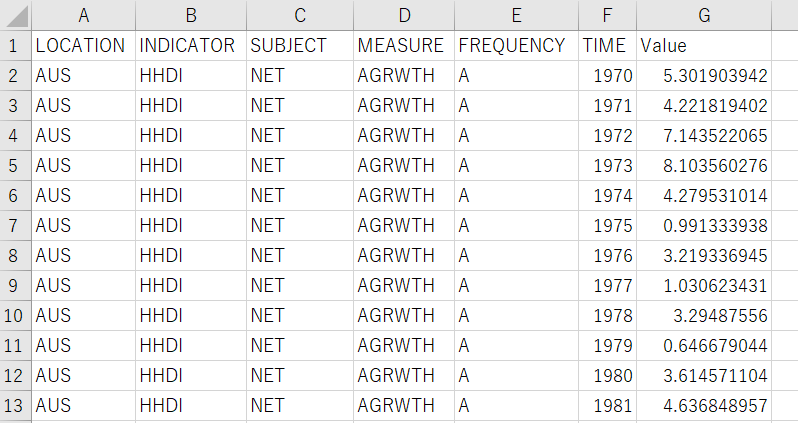
Household accounts - Household disposable income - OECD Data
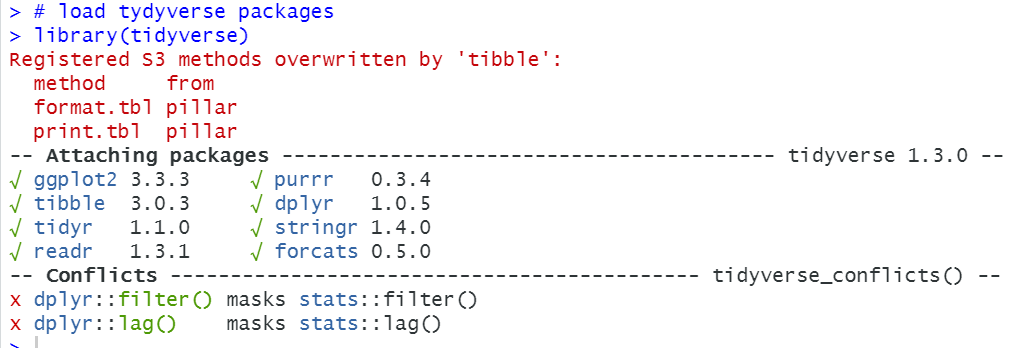
I got below CSV file from the web site.
I will import this data into R.
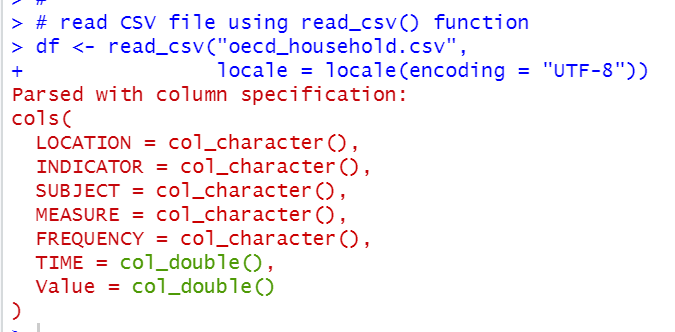
First of all, I load tidyverse packages.
Then, I use read_csv() function to import CSV data into R.
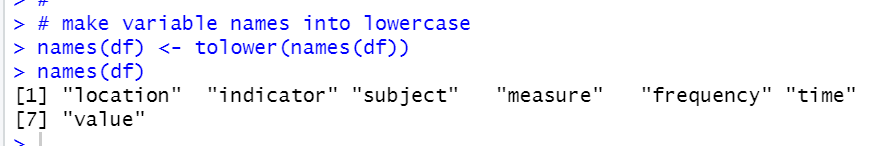
I use tolower() function to variable names into lowercase.
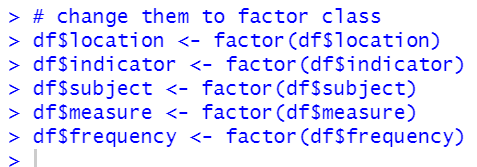
From location to frequency, I change them to factor class.
Then, I use summary() function to see data frame; df summary.
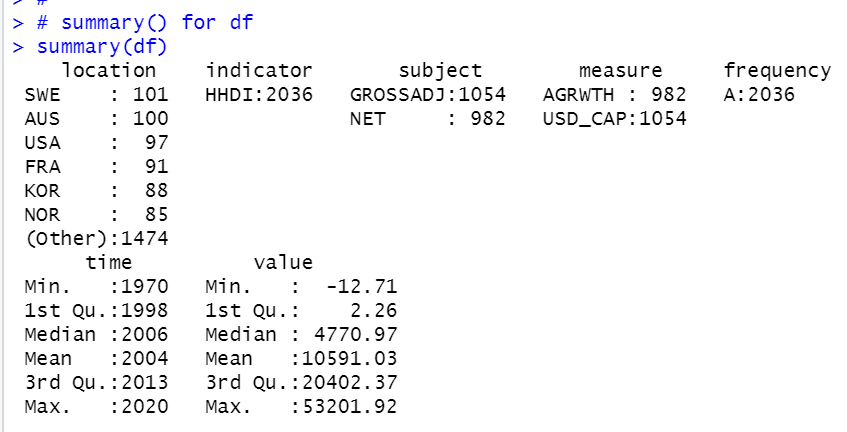
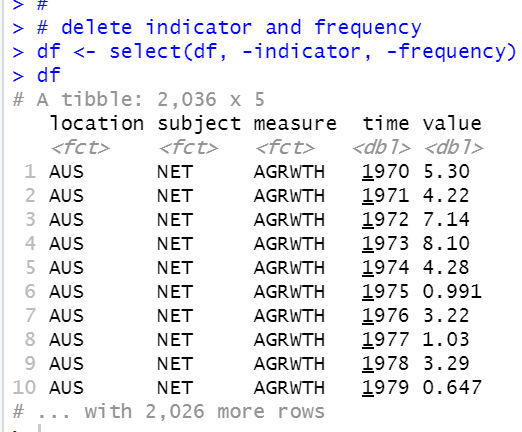
We see indicator has one observation value; HHDI. HHDI stands for HouseHold Disposable Income, I think. We can delete this variable. frequency also has only one observation value; A. A means Annual. We can also delete this.
We see there is not NA value in the data frame.
That's it. Thank you!
The next post is..